883
Views
8
CrossRef citations to date
0
Altmetric
Research Paper

Changes in nucleosome position at transcriptional start sites of specific genes in Zea mays mediator of paramutation1mutants

, &
Pages 398-408 | Received 01 Feb 2013, Accepted 05 Mar 2013, Published online: 28 Mar 2013

Figures & data

Figure 1. Agarose gel fractionation of MNase digested DNA from leaf, immature tassel, ear shoot and seedlings of homozygous wild type (WT MOP1) and homozygous mutant mop1–1 (MUT mop1–1) plants. For each genotype and tissue type, separate reactions were conducted using 0.5, 0.75, and 1 unit of MNase respectively. Lanes with molecular weight markers are indicated (λ HindIII and Lad); the size of each band is indicated in base pairs.
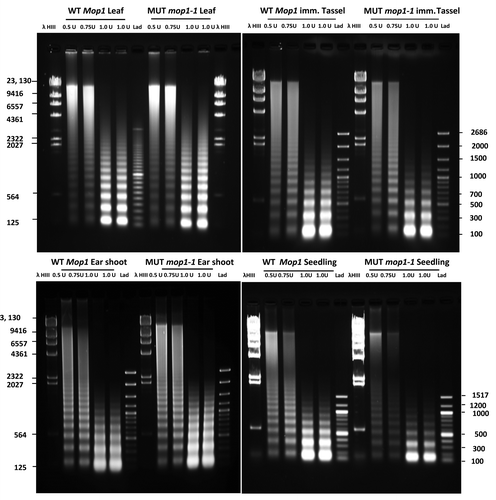
Figure 1. Agarose gel fractionation of MNase digested DNA from leaf, immature tassel, ear shoot and seedlings of homozygous wild type (WT MOP1) and homozygous mutant mop1–1 (MUT mop1–1) plants. For each genotype and tissue type, separate reactions were conducted using 0.5, 0.75, and 1 unit of MNase respectively. Lanes with molecular weight markers are indicated (λ HindIII and Lad); the size of each band is indicated in base pairs.

Figure 2. Schematic representation of comparative genomic hybridization (CGH) on the 400 gene TSS microarray for 13 exemplar genes with their respective chromosomal locations. The magnitude of sequence differences (ratio of the log2 ratios of signal intensity for respective samples) between wild type and mutant mop1–1 is displayed on the y axis for each gene. A value of 1 in the bar chart indicates that there is no detectable difference in hybridization behavior between the genomic DNA from wild type and mutant mop1–1 individuals in the probed region for the gene.
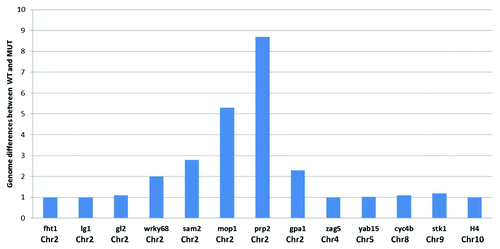
Figure 2. Schematic representation of comparative genomic hybridization (CGH) on the 400 gene TSS microarray for 13 exemplar genes with their respective chromosomal locations. The magnitude of sequence differences (ratio of the log2 ratios of signal intensity for respective samples) between wild type and mutant mop1–1 is displayed on the y axis for each gene. A value of 1 in the bar chart indicates that there is no detectable difference in hybridization behavior between the genomic DNA from wild type and mutant mop1–1 individuals in the probed region for the gene.

Figure 3. Nucleosome distribution plots for 3 genes exhibiting differences between wild type and mop1–1 homozygous mutants. The x-axis shows the coordinates of the genes flavanone 3-hydroxylase1 ((A), liguleless1 (B), and yabby15 (C) on their respective chromosomes, while the y-axis represent the log 2 ratio of the signal intensity between the test (nucleosomal DNA) and reference (genomic DNA) samples. The black lines represent replicates of wild type MOP1, while the red lines represent replicates of mutant mop1–1. The location and direction of transcription is indicated with an arrow and label for each gene. Open arrows indicate regions where nucleosome occupancy appears to vary between wild type and mutant plants. For yabby15 and liguless1, the plots represent a comparison of wild type and mutant immature tassel samples. For flavanone 3-hydroxylase1, the plot represents a comparison of wild type and mutant ear shoot samples.
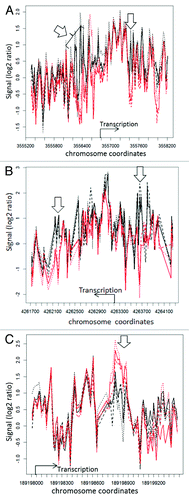
Figure 3. Nucleosome distribution plots for 3 genes exhibiting differences between wild type and mop1–1 homozygous mutants. The x-axis shows the coordinates of the genes flavanone 3-hydroxylase1 ((A), liguleless1 (B), and yabby15 (C) on their respective chromosomes, while the y-axis represent the log 2 ratio of the signal intensity between the test (nucleosomal DNA) and reference (genomic DNA) samples. The black lines represent replicates of wild type MOP1, while the red lines represent replicates of mutant mop1–1. The location and direction of transcription is indicated with an arrow and label for each gene. Open arrows indicate regions where nucleosome occupancy appears to vary between wild type and mutant plants. For yabby15 and liguless1, the plots represent a comparison of wild type and mutant immature tassel samples. For flavanone 3-hydroxylase1, the plot represents a comparison of wild type and mutant ear shoot samples.

Table 1. Genes showing consistent differences in nucleosome distribution between wild type and mop1–1 mutants

Table 2. Comparison between observed nucleosome distribution and support vector machine predicted nucleosome-forming and -inhibitory sequences in the TSSs of three genes with altered nucleosome distribution in mop1–1 mutants

Figure 4. Real time PCR results for flavanone 3-hydroxylase1 (A) liguleless1 (B) yabby15 (C), and colored plant1 (D). Transcript abundance was measured in leaf, tassel and ear shoot of mop1–1/mop1–1 mutant (MUT) and wild type MOP1/MOP1 (WT) plants using ubiquitin as an endogenous control. Relative quantification (Rq) values were averaged for three replicates of mop1–1 samples for each tissue type, and compared with the average value for three replicates of wild type samples (set at 1 for each tissue type). The averaged Rq values are plotted on the y-axis. Error bars represent standard error for the averaged Rq values.
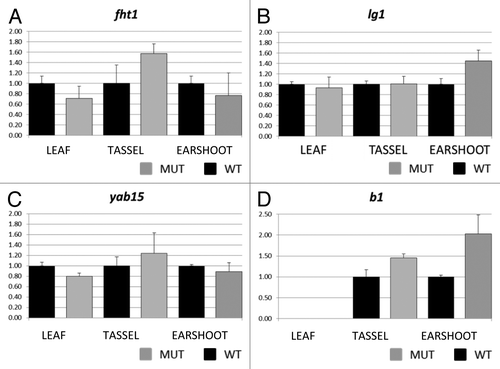
Figure 4. Real time PCR results for flavanone 3-hydroxylase1 (A) liguleless1 (B) yabby15 (C), and colored plant1 (D). Transcript abundance was measured in leaf, tassel and ear shoot of mop1–1/mop1–1 mutant (MUT) and wild type MOP1/MOP1 (WT) plants using ubiquitin as an endogenous control. Relative quantification (Rq) values were averaged for three replicates of mop1–1 samples for each tissue type, and compared with the average value for three replicates of wild type samples (set at 1 for each tissue type). The averaged Rq values are plotted on the y-axis. Error bars represent standard error for the averaged Rq values.
Supplemental material

Additional material

Download Zip (714.6 KB)