3,117
Views
112
CrossRef citations to date
0
Altmetric
Brief Report

Large-scale global identification of protein lysine methylation in vivo

, &
Pages 477-485 | Received 03 Jan 2013, Accepted 03 Apr 2013, Published online: 17 Apr 2013

Figures & data

Figure 1. Characterization of the antibodies against mono-, di- and tri-methyl lysine. (A) Dot blot analysis of the pan anti-methyl lysine antibodies. Peptides with un- (Kun), mono- (Kme1), di- (Kme2) and tri- (Kme3) methyl lysine were blotted onto nitrocellulose membranes and probed with the antibodies, respectively. (B) Immunoprecipitation (IP) analysis of lysates prepared from HeLa cells using the antibodies. Lanes A, B and C are input, IP eluates with normal rabbit IgG (negative control) and IP eluates with anti-methyl lysine antibodies, respectively. The concentration of SDS-PAGE was 15%. (C) Lysine methylation profiles in 13 human cell lines. The protein lysates of 13 cell lines were separated by 12.5% SDS-PAGE, transferred to PVDF membranes and probed with the antibodies, respectively.
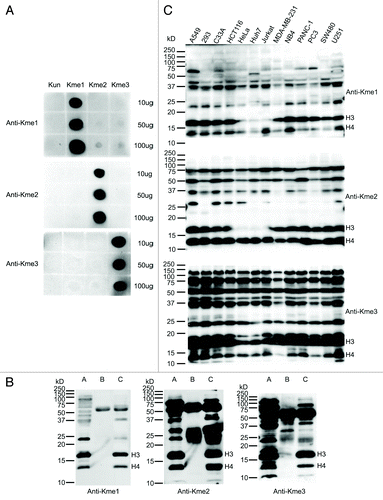
Figure 1. Characterization of the antibodies against mono-, di- and tri-methyl lysine. (A) Dot blot analysis of the pan anti-methyl lysine antibodies. Peptides with un- (Kun), mono- (Kme1), di- (Kme2) and tri- (Kme3) methyl lysine were blotted onto nitrocellulose membranes and probed with the antibodies, respectively. (B) Immunoprecipitation (IP) analysis of lysates prepared from HeLa cells using the antibodies. Lanes A, B and C are input, IP eluates with normal rabbit IgG (negative control) and IP eluates with anti-methyl lysine antibodies, respectively. The concentration of SDS-PAGE was 15%. (C) Lysine methylation profiles in 13 human cell lines. The protein lysates of 13 cell lines were separated by 12.5% SDS-PAGE, transferred to PVDF membranes and probed with the antibodies, respectively.

Figure 2. Illustration of the study strategy and characterization of the methylation sites. (A) Illustration of the study strategy. HeLa cells cultured in normal or 13CD3-methionine medium were lysed, or sub-cellularly fractionated to separate cytoplasm and nucleus, and their protein lysates were digested by trypsin. The methylated peptides were enriched through immunoprecipitation and underwent strong cation-exchange (SCX) separation. Each fraction was desalted and subjected to mass spectrometry. (B) MS/MS spectra of the methylated peptide, TKme1AAAAAAAAAPAAAATAPTTAATTAATAAQ. The upper and lower spectra come from normal and heavy methyl-labeled samples, respectively. (C) Heat map of relative distribution of amino acids around the methylated lysine sites. Amino acids from -6 to +6 positions adjacent to the methylated lysine sites and all lysine residues were extracted, respectively. At each position, the frequency of amino acid around methylated lysine sites was divided by that around all lysine residues, and the ratios were visually represented after logarithmic transformation (log2). Color scale reflects the degree of enrichment (red) or depletion (blue). (D) Evolutionary conservation of the methylated lysine sites and all lysines throughout the eukaryotic species. “Kme” and “K” denote methylated lysines and all lysines, respectively. (E) Distribution of methylated lysines and all lysines in protein secondary structure. “Kme” and “K” denote methylated lysines and all lysines, respectively.
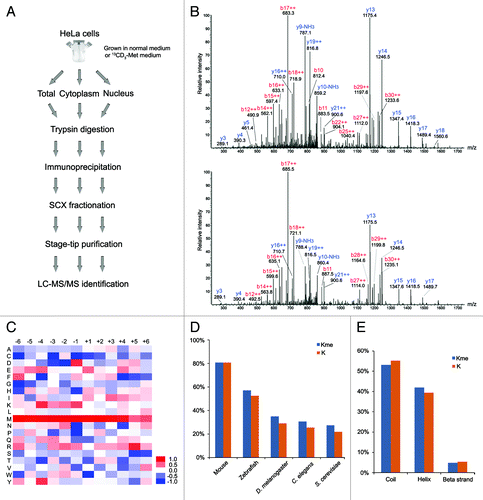
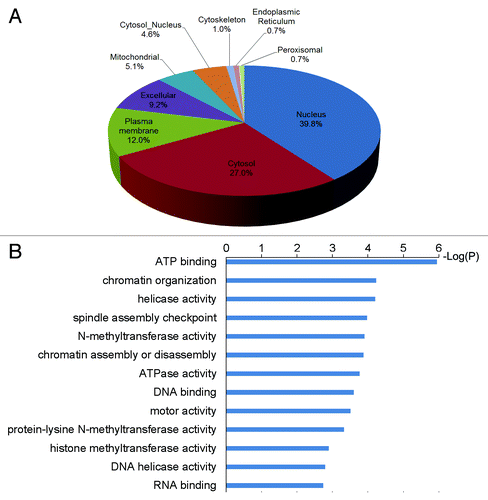
Figure 2. Illustration of the study strategy and characterization of the methylation sites. (A) Illustration of the study strategy. HeLa cells cultured in normal or 13CD3-methionine medium were lysed, or sub-cellularly fractionated to separate cytoplasm and nucleus, and their protein lysates were digested by trypsin. The methylated peptides were enriched through immunoprecipitation and underwent strong cation-exchange (SCX) separation. Each fraction was desalted and subjected to mass spectrometry. (B) MS/MS spectra of the methylated peptide, TKme1AAAAAAAAAPAAAATAPTTAATTAATAAQ. The upper and lower spectra come from normal and heavy methyl-labeled samples, respectively. (C) Heat map of relative distribution of amino acids around the methylated lysine sites. Amino acids from -6 to +6 positions adjacent to the methylated lysine sites and all lysine residues were extracted, respectively. At each position, the frequency of amino acid around methylated lysine sites was divided by that around all lysine residues, and the ratios were visually represented after logarithmic transformation (log2). Color scale reflects the degree of enrichment (red) or depletion (blue). (D) Evolutionary conservation of the methylated lysine sites and all lysines throughout the eukaryotic species. “Kme” and “K” denote methylated lysines and all lysines, respectively. (E) Distribution of methylated lysines and all lysines in protein secondary structure. “Kme” and “K” denote methylated lysines and all lysines, respectively.

Table 1. Overview of the protein lysine methylation identification in HeLa cells. Normal (normal medium-cultured sample) and heavy (13CD3-methionine medium-cultured sample), respectively

Figure 3.(A) Subcellular localization of methylated proteins. (B) Over-represented GO terms of methylated proteins.

Figure 3.(A) Subcellular localization of methylated proteins. (B) Over-represented GO terms of methylated proteins.
Supplemental material

Additional material

Download Zip (763.6 KB)

Reprints and Corporate Permissions

Please note: Selecting permissions does not provide access to the full text of the article, please see our help page How do I view content?

To request a reprint or corporate permissions for this article, please click on the relevant link below:

Academic Permissions

Please note: Selecting permissions does not provide access to the full text of the article, please see our help page How do I view content?

Obtain permissions instantly via Rightslink by clicking on the button below:

If you are unable to obtain permissions via Rightslink, please complete and submit this Permissions form. For more information, please visit our Permissions help page.