1,739
Views
45
CrossRef citations to date
0
Altmetric
Research Paper

Comprehensive methylome analysis of ovarian tumors reveals hedgehog signaling pathway regulators as prognostic DNA methylation biomarkers

, , , , , , , , , , , , , & show all
Pages 624-634 | Received 26 Mar 2013, Accepted 24 Apr 2013, Published online: 10 May 2013

Figures & data

Figure 1. Strategy for discovering novel methylated genes in ovarian cancer using MethylCap-seq. (A) Flowchart of the experimental design. (B) Histograms show the number of mapped reads in 101 ovarian samples. At least 10 million uniquely mapped reads per sample were used in the analysis. Pie charts illustrating the percentage of differential methylation regions (DMRs) of promoter CpG islands (CGI) and non-promoter CGI. (C) Methylation profiles of 577 DMRs locate at ± 4 kb spanning from transcription start site (TSS) in malignant, benign and normal ovarian samples. Each row shows a DMR region overlapping a TSS. Average of the methylation levels was calculated for 75 malignant (left), 20 benign (middle) and 6 normal (right) ovarian tissues. Each 200 base pairs is a bin to show the methylation profiles in an 8K region. (D) Area under the receiver operating curves (AUC) shows the accuracy for distinguishing malignant samples and non-malignant samples (containing benign and normal). The average methylation level of 577 DMRs and top 10% DMRs (n = 57) shows higher 87% accuracy for distinguishing malignant and non-malignant ovarian tissue.
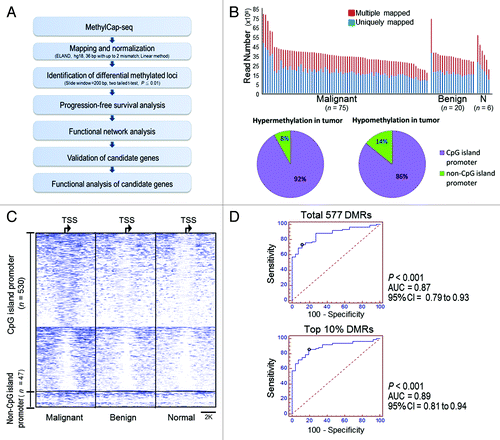
Figure 1. Strategy for discovering novel methylated genes in ovarian cancer using MethylCap-seq. (A) Flowchart of the experimental design. (B) Histograms show the number of mapped reads in 101 ovarian samples. At least 10 million uniquely mapped reads per sample were used in the analysis. Pie charts illustrating the percentage of differential methylation regions (DMRs) of promoter CpG islands (CGI) and non-promoter CGI. (C) Methylation profiles of 577 DMRs locate at ± 4 kb spanning from transcription start site (TSS) in malignant, benign and normal ovarian samples. Each row shows a DMR region overlapping a TSS. Average of the methylation levels was calculated for 75 malignant (left), 20 benign (middle) and 6 normal (right) ovarian tissues. Each 200 base pairs is a bin to show the methylation profiles in an 8K region. (D) Area under the receiver operating curves (AUC) shows the accuracy for distinguishing malignant samples and non-malignant samples (containing benign and normal). The average methylation level of 577 DMRs and top 10% DMRs (n = 57) shows higher 87% accuracy for distinguishing malignant and non-malignant ovarian tissue.

Figure 2. A panel of DMRs associated with prognostic outcome and pathogically functional pathways. (A) Heatmap illustrating the methylation levels of 63 DMRs at promoter regions (± 2Kb spanning the transcription start site (TSS). The DMRs are listed in Table S2. High methylation-DMR (HM-DMR) was defined by 60th percentile of each gene in 75 malignant samples for prognostic analysis. Malignant tissues derived from patients with recurrent disease were associated with HM-DMRs (black gradient). (B) High frequency HM-DMRs (high freq HM-DMRs) were associated with poor progression-free survival (PFS). freq, frequency. (C) Restored gene expression in ovarian cells after epigenetic drug treatments. Expression of each gene examined was restored in at least one of the ovarian cell lines. (D) Network analysis showing the closest functions for high methylated genes. The weight of the edge indicates the probability of genes to connect components (contained gene or proteins) in the functional pathways. Red squares represent proteins involved in signaling pathway and blue circles represent genes. The blue gradient indicates methylation level.
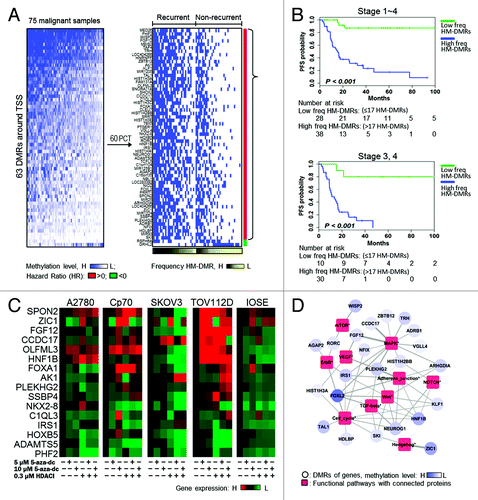
Figure 2. A panel of DMRs associated with prognostic outcome and pathogically functional pathways. (A) Heatmap illustrating the methylation levels of 63 DMRs at promoter regions (± 2Kb spanning the transcription start site (TSS). The DMRs are listed in Table S2. High methylation-DMR (HM-DMR) was defined by 60th percentile of each gene in 75 malignant samples for prognostic analysis. Malignant tissues derived from patients with recurrent disease were associated with HM-DMRs (black gradient). (B) High frequency HM-DMRs (high freq HM-DMRs) were associated with poor progression-free survival (PFS). freq, frequency. (C) Restored gene expression in ovarian cells after epigenetic drug treatments. Expression of each gene examined was restored in at least one of the ovarian cell lines. (D) Network analysis showing the closest functions for high methylated genes. The weight of the edge indicates the probability of genes to connect components (contained gene or proteins) in the functional pathways. Red squares represent proteins involved in signaling pathway and blue circles represent genes. The blue gradient indicates methylation level.

Figure 3. Analysis of ZIC family methylation patterns. (A) Methylation profiles of CpG islands located at regions around ZIC1, ZIC4, ZIC2 and ZIC5 on the genome browser. The left panel shows Chr3: 148,584,017 ~14,869,093 and contains nine CGIs (CGI 1~9); right panel shows Chr13: 99,401,912 ~99,450,871 and contains eight CGIs (CGI 10~17). Around ZIC1 and ZIC4, the region presents high methylation in malignant samples. However, some malignant samples showed low methylation (middle of the genome browser). (B) Estimating correlations between CGIs. High concordance of methylated CGI at chromosome 3 but not at chromosome 13. CGI 4 is highly concordant with CGI 1, 2, 5 and 6, and the CGIs related to exon loci. (C) Validation of methylation levels of ZIC1 promoter used bisulfite pyrosequencing. Validated regions were located 439 to 496 base pair upstream from the TSS (transcriptional orientation indicated by the arrow). The red boxes show that methylation levels of 86 malignant samples are higher (p < 0.001 by Mann-Whitney U test) than 35 non-malignant samples (containing 15 benign, 6 normal tissues and 14 normal paraffin tissues) and squares indicate outliers. (D) Area under the receiver operating curves (AUC) was used to estimate the accuracy of predicting malignant samples associated by methylation levels. The average of seven CG sites accurately distinguished 80% of malignant samples using a 41.7% methylation cutoff value.
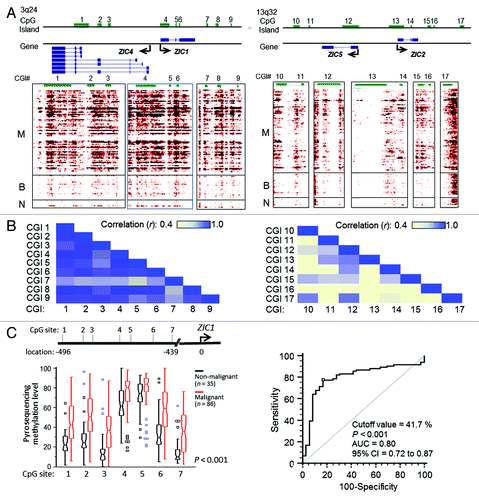
Figure 3. Analysis of ZIC family methylation patterns. (A) Methylation profiles of CpG islands located at regions around ZIC1, ZIC4, ZIC2 and ZIC5 on the genome browser. The left panel shows Chr3: 148,584,017 ~14,869,093 and contains nine CGIs (CGI 1~9); right panel shows Chr13: 99,401,912 ~99,450,871 and contains eight CGIs (CGI 10~17). Around ZIC1 and ZIC4, the region presents high methylation in malignant samples. However, some malignant samples showed low methylation (middle of the genome browser). (B) Estimating correlations between CGIs. High concordance of methylated CGI at chromosome 3 but not at chromosome 13. CGI 4 is highly concordant with CGI 1, 2, 5 and 6, and the CGIs related to exon loci. (C) Validation of methylation levels of ZIC1 promoter used bisulfite pyrosequencing. Validated regions were located 439 to 496 base pair upstream from the TSS (transcriptional orientation indicated by the arrow). The red boxes show that methylation levels of 86 malignant samples are higher (p < 0.001 by Mann-Whitney U test) than 35 non-malignant samples (containing 15 benign, 6 normal tissues and 14 normal paraffin tissues) and squares indicate outliers. (D) Area under the receiver operating curves (AUC) was used to estimate the accuracy of predicting malignant samples associated by methylation levels. The average of seven CG sites accurately distinguished 80% of malignant samples using a 41.7% methylation cutoff value.

Figure 4. Correlation of ZIC expression and hypermethylation in patient samples and GLI expression in ovarian cells. (A) Comparison of methylation and gene expression in 406 ovarian tumors from The Cancer Genome Atlas (TCGA).Citation23 The methylation level is according the AVG β-value (0 to 1 represents low to high methylation in the 27K methylation bead array). Using the same interval of AVG β divides the 5 groups. The gene expression directly used the level 3 data. ZIC1 methylation was negatively correlated (p < 0.001) with ZIC1 expression. (B) The association between expression of ZIC1, ZIC4, and GLIs in ovarian cells treated Hedgehog (Hh) and/or DNA methylation inhibitor. Repressed expression of GLIs in SKOV3 and Cp70 after treatment with Hh inhibitor. Restored ZIC1 and ZIC4 expression was associated with reduced GLI2 in SKOV3 and Cp70. Ctrl, no drug treatment. (C) GLIs expression changes after transient transfection of ZIC1 or ZIC4. High expression of exogenous ZIC1 and ZIC4 was significantly associated with reduced GLI2 in SKOV3 and Cp70. (*p < 0.05; **p < 0.01 and ***p < 0.001 by two-tailed t-test).
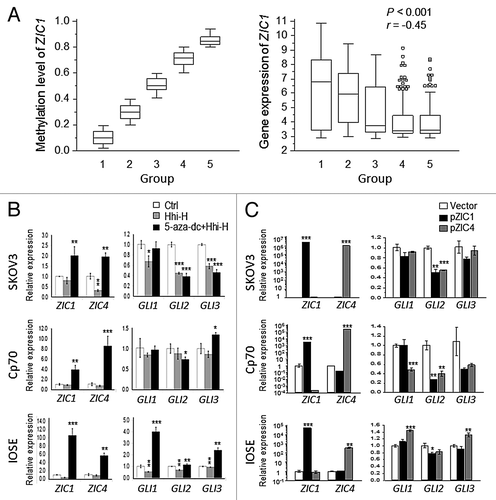
Figure 4. Correlation of ZIC expression and hypermethylation in patient samples and GLI expression in ovarian cells. (A) Comparison of methylation and gene expression in 406 ovarian tumors from The Cancer Genome Atlas (TCGA).Citation23 The methylation level is according the AVG β-value (0 to 1 represents low to high methylation in the 27K methylation bead array). Using the same interval of AVG β divides the 5 groups. The gene expression directly used the level 3 data. ZIC1 methylation was negatively correlated (p < 0.001) with ZIC1 expression. (B) The association between expression of ZIC1, ZIC4, and GLIs in ovarian cells treated Hedgehog (Hh) and/or DNA methylation inhibitor. Repressed expression of GLIs in SKOV3 and Cp70 after treatment with Hh inhibitor. Restored ZIC1 and ZIC4 expression was associated with reduced GLI2 in SKOV3 and Cp70. Ctrl, no drug treatment. (C) GLIs expression changes after transient transfection of ZIC1 or ZIC4. High expression of exogenous ZIC1 and ZIC4 was significantly associated with reduced GLI2 in SKOV3 and Cp70. (*p < 0.05; **p < 0.01 and ***p < 0.001 by two-tailed t-test).

Figure 5.ZIC1 or ZIC4 overexpression modulates ovarian cancer cell migration/invasion and ZIC1 methylation is related to disease outcome. (A and B) Effect of overexpression of ZIC1 or ZIC4 on cell migration and invasion in SKOV3. Representative results of cells stained with Hochest33324 and results of quantitative migration and invasion assays are shown. The results of three independent experiments were analyzed by Mann-Whitney U test (p < 0.001). (C) High methylation CpG sites at ZIC1 promoter are related to poor progression free survival. The cutoff values used to dichotomize high- and low- methylation for CpG site 6 and 7 were 52.59 and 30.03, respectively (see Table S3).
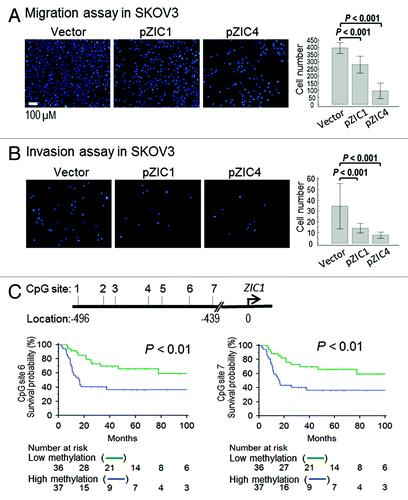
Figure 5.ZIC1 or ZIC4 overexpression modulates ovarian cancer cell migration/invasion and ZIC1 methylation is related to disease outcome. (A and B) Effect of overexpression of ZIC1 or ZIC4 on cell migration and invasion in SKOV3. Representative results of cells stained with Hochest33324 and results of quantitative migration and invasion assays are shown. The results of three independent experiments were analyzed by Mann-Whitney U test (p < 0.001). (C) High methylation CpG sites at ZIC1 promoter are related to poor progression free survival. The cutoff values used to dichotomize high- and low- methylation for CpG site 6 and 7 were 52.59 and 30.03, respectively (see Table S3).

Table 1. Univariate and multivariate Cox survival analysis for the association between the risk of high methylation of ZIC1 at CpG site 6, clinical variables and progression free survival

Supplemental material

Additional material

Download Zip (790.4 KB)