Figures & data
Table 1. Clinical and molecular characteristics of the present CLL cohort
Figure 1. Kaplan-Meier curves for time to first treatment (TTFT) and overall survival (OS) in relation to ANGPT2 mRNA expression. In (A and B), 88 CLL patients were divided according to high and low ANGPT2 expression using the cut-off value 2.967×10⁻⁶ (relative mRNA expression of ANGPT2 to B2M). High ANGPT2 expressing cases show significantly shorter TTFT [(A) median 25 vs. 97 mo, p = 0.046; log-rank test) and OS [(B) median 59 vs 177 mo, p < 0.001; log-rank test] compared with low ANGPT2 expressing cases.
![Figure 1. Kaplan-Meier curves for time to first treatment (TTFT) and overall survival (OS) in relation to ANGPT2 mRNA expression. In (A and B), 88 CLL patients were divided according to high and low ANGPT2 expression using the cut-off value 2.967×10⁻⁶ (relative mRNA expression of ANGPT2 to B2M). High ANGPT2 expressing cases show significantly shorter TTFT [(A) median 25 vs. 97 mo, p = 0.046; log-rank test) and OS [(B) median 59 vs 177 mo, p < 0.001; log-rank test] compared with low ANGPT2 expressing cases.](/cms/asset/20123413-a6d3-4a7e-b87a-b9907e0e542d/kepi_a_10924947_f0001.gif)
Figure 2. Location of the six CpG sites analyzed by pyrosequencing in relation to transcriptional start site of ANGPT2 gene. The circled region represents the studied CpG island of ANGPT2 gene which was predicted by the site www.urogene.org/methprimer using the following criteria: island size > 100, GC percent > 0.0, obs/exp CpG > 0.6. The start site and the direction of ANGPT2 transcription are indicated by the arrow. The below sequence shows in details the positions of the 6 CpG sites analyzed by pyrosequencing. The CpG site 2 is the same site identified in our previous methylation study.Citation26
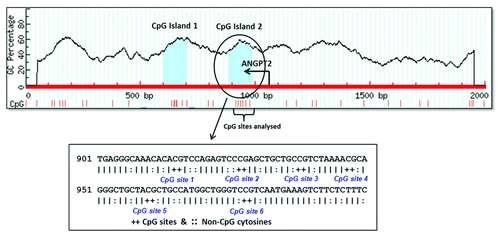
Table 2. Methylation percentages of the 6 CpG sites located around the transcription start site of the ANGPT2 gene measured by pyrosequencing in 88 CLL patients
Figure 3. Relations between ANGPT2 CpG methylation, ANGPT2 mRNA expression and IGHV mutational status in 88 CLL patients. The percentage of ANGPT2 methylation (average of all 6 CpG sites) is plotted against ANGPT2 mRNA expression (A) and IGHV mutational status (B). The horizontal lines inside boxes indicate the median values. (A) CLL cases are divided in high and low ANGPT2 expression according to cut off value 2.967×10⁻⁶ (relative mRNA expression of ANGPT2 to B2M). High ANGPT2 expressing patients have significantly lower ANGPT2 methylation than low ANGPT2 expressing cases (median 50 vs. 76%; p < 0.001; Mann–Whitney test). (B) IGHV-unmutated patients have significantly lower ANGPT2 methylation than mutated cases (median 50 vs. 76%; p < 0.001; Mann–Whitney test).
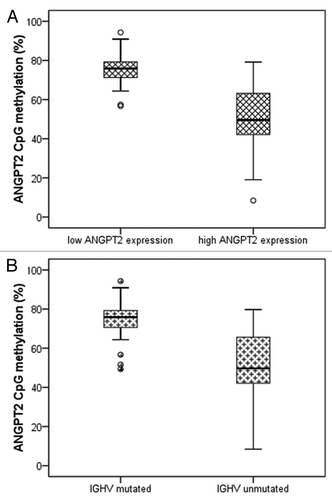
Figure 4. Kaplan-Meier curves for time to first treatment (TTFT) and overall survival (OS) in relation to ANGPT2 CpG methylation. In (A and B), 88 CLL patients were divided according to high and low ANGPT2 methylation using the cut-off value 73% (methylation percentage, average of all 6 CpG sites). Low ANGPT2 methylation cases had significantly shorter TTFT [(A) median 23 vs. 97 mo, p = 0.022; log-rank test] and OS [(B) median 79 vs. 177 mo, p = 0.018; log-rank test] compared with cases with high ANGPT2 methylation.
![Figure 4. Kaplan-Meier curves for time to first treatment (TTFT) and overall survival (OS) in relation to ANGPT2 CpG methylation. In (A and B), 88 CLL patients were divided according to high and low ANGPT2 methylation using the cut-off value 73% (methylation percentage, average of all 6 CpG sites). Low ANGPT2 methylation cases had significantly shorter TTFT [(A) median 23 vs. 97 mo, p = 0.022; log-rank test] and OS [(B) median 79 vs. 177 mo, p = 0.018; log-rank test] compared with cases with high ANGPT2 methylation.](/cms/asset/5eb0bd26-11d1-424f-970b-a926f0702c95/kepi_a_10924947_f0004.gif)
Table 3. Associations between ANGPT2 methylation status and CLL prognostic factors
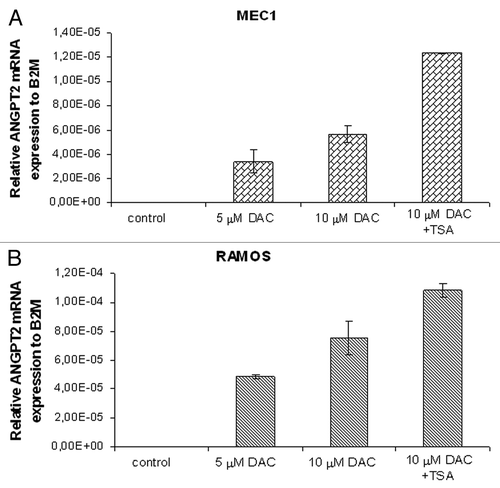
Figure 5. The relative expression of ANGPT2 gene to B2M after 72 h of DAC/TSA treatment in the MEC1 and RAMOS cell lines. Real-time PCR analyses showing re-expression of the methylated ANGPT2 gene in the MEC1 and RAMOS cells after treatment with increasing concentrations of the methyl transferase inhibitor 5-aza-2’-deoxycytidine (DAC) are represented in (A and B). In (A), mean ANGPT2 mRNA levels of MEC1 cells are 0 in control (no treatment), 3.39×10⁻⁶ with 5 μM DAC and 5.68×10⁻⁶ with 10 μM DAC. The last MEC1 sample with highest expression (1.24×10⁻⁵, mean ANGPT2 mRNA level) was treated with a combination of DAC (10 μM) and the histone deacetylase inhibitor, Trichostatin A (TSA). In (B), mean ANGPT2 mRNA levels of RAMOS cells are 0 in the control, 4.87×10⁻⁵ with 5 μM DAC and 7.54×10⁻⁵ with 10 μM DAC. The RAMOS sample with highest expression (1.08×10⁻⁴, mean ANGPT2 mRNA level) was obtained with 10 μM DAC plus TSA treatment. All data are represented in graph as mean ± standard deviation of at least 2 independent experiments.