Figures & data
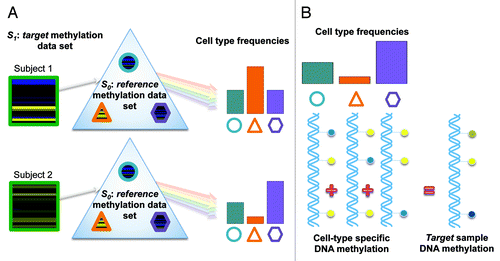
Figure 1. Illustration of the blood cell mixture deconvolution approach. This approach involves, (A) constrained projection of DNA methylation profiles from a target methylation data set (S1) onto a reference data set (S0 ), which is comprised of the DNA methylation signatures for isolated white blood cell types (shapes reflect different white blood cell types). The result is an estimate of the underlying distribution of cell proportions (circle, triangle and hexagon) for each sample within S1. (B) This approach assumes that the methylation signature for samples within S1 are the weighted sum of the methylation signatures from individual white blood cell types, where the weights are proportional to the cell-type frequencies.

Figure 2. Complete blood cell (CBC) and predicted proportions of white blood cell types in the target methylation data set. CBC derived proportions [i.e., Ω(CBC)] of white blood cell types in (A) whole-blood and (B) peripheral blood mononuclear cell (PBMCs) (i.e., devoid of granulocytes) for the samples in the target methylation data set. (C) Predicted proportions (i.e., ) of CD8+ T-lymphocytes (CD8T), CD4+ T-lymphocytes (CD4T), Natural killer cells (NK), B cells (Bcell), Monocytes (Mono) and Granulocytes (Gran) for the target samples using constrained projection (CP). Black bars denote the median and the red dashed bars denote the 75th and 25th percentiles for the predicted cell-type proportions. Colored points indicate subjects with replicate samples, where two points of the same color denote replicate samples for the same subject.
![Figure 2. Complete blood cell (CBC) and predicted proportions of white blood cell types in the target methylation data set. CBC derived proportions [i.e., Ω(CBC)] of white blood cell types in (A) whole-blood and (B) peripheral blood mononuclear cell (PBMCs) (i.e., devoid of granulocytes) for the samples in the target methylation data set. (C) Predicted proportions (i.e., ) of CD8+ T-lymphocytes (CD8T), CD4+ T-lymphocytes (CD4T), Natural killer cells (NK), B cells (Bcell), Monocytes (Mono) and Granulocytes (Gran) for the target samples using constrained projection (CP). Black bars denote the median and the red dashed bars denote the 75th and 25th percentiles for the predicted cell-type proportions. Colored points indicate subjects with replicate samples, where two points of the same color denote replicate samples for the same subject.](/cms/asset/eb573dd2-1561-44a0-8629-c4661c9aa7b6/kepi_a_10925430_f0002.gif)
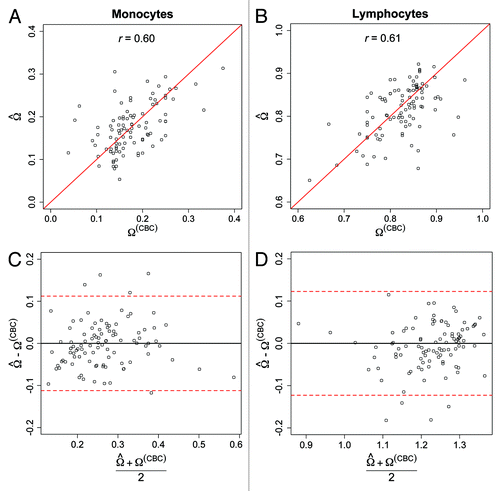
Figure 3. Comparison of the predicted and CBC derived proportions of monocytes and lymphocytes among the target samples. Scatter-plot of the predicted and CBC-derived proportions of (A) monocytes and (B) lymphocytes. Solid red lines represent the unity lines (i.e., y = x). Bland–Altman plots for (C) monocyte and (D) lymphocyte proportions. Y-axes represent the difference in the predicted and CBC-derived cell-type proportions, and X-axes represent the mean cell-type proportions based on CP prediction and CBC-based proportions. Red-dotted lines indicate the global bootstrap-based 95% prediction intervals for the difference in predicted and CBC-derived cell-type proportions.

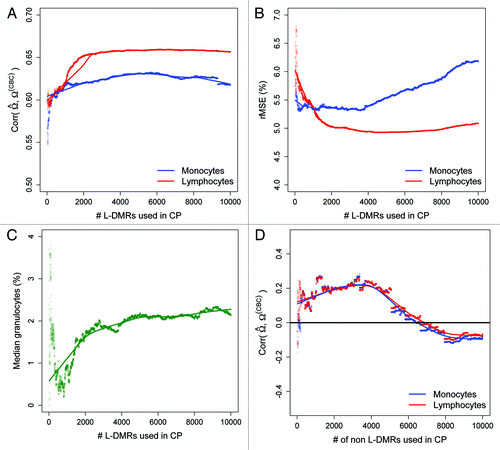
Figure 4. Prediction performance as a function of the number of L-DMRs used in CP. (A) Pearson correlation between the predicted and CBC-derived proportions of monocytes (blue line) and lymphocytes (red line) as a function of the numbers of L-DMRs used in CP. (B) root mean squared error (rMSE) for monocytes and lymphocytes and (C) median (%) granulocytes as a function of the numbers of L-DMRs used in CP. (D) Pearson correlation between the predicted and CBC-derived proportions of monocytes and lymphocytes as a function of the numbers of non L-DMRs (negative controls) used in CP.
