Figures & data
Figure 1.MAGEA11 expression in human prostate cancer. (A-C) Oncomine analysis of MAGEA11 expression. Fold change, P-value, and microarray platform is indicated, and the title shows the first author of the referenced studies Citation61, Citation62. Data are presented as a box and whiskers plot, with the box indicating the 25th to 75th percentiles, whiskers indicating the 10th and 90th percentiles, top and bottom points indicating the range, and center line indicating the median. (A) MAGEA11 expression as a function of prostate cancer Gleason grade. (B) MAGEA11 expression in primary and metastatic prostate cancer. (C) MAGEA11 expression as a function of prostate cancer recurrence at one year. (D) Expression of MAGEA11 and three representative CG antigen genes, MAGEA1, NY-ESO-1 and XAGE1 in prostate cell lines was measured using RT-qPCR. PWR-1E and RWPE-2 are cell lines derived from benign prostate epithelium, while the other cell lines were derived from prostate cancers. (E) Gene expression was measured as described in (D), using primary tissues derived from benign prostatic hyperplasia (BP), androgen-stimulated prostate cancer (AS), and castration-recurrent prostate cancer (CR). Absence of a bar indicates that no expression was detected.
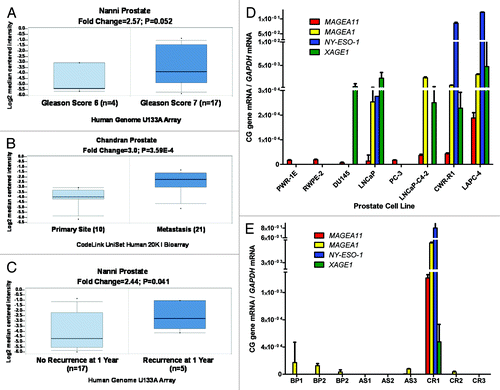
Figure 2.MAGEA11 expression in epithelial ovarian cancer (EOC). (A) Oncomine analysis of MAGEA11 mRNA expression in TCGA data Citation63. Fold change, P-value, and microarray platform is indicated. Data presentation is as described in . (B) Oncomine analysis of the genes most closely correlated with MAGEA11 in TCGA data. (C) MAGEA11 mRNA expression was determined in three normal ovary samples and 40 EOC samples using Affymetrix HG 1.0ST microarrays. Two-tailed t-test results are shown. (D) Expression of MAGEA11 and other CG antigen genes was determined by Affymetrix microarray, as described in (C). Spearman test r values and P-values for correlation with MAGEA11 are shown.
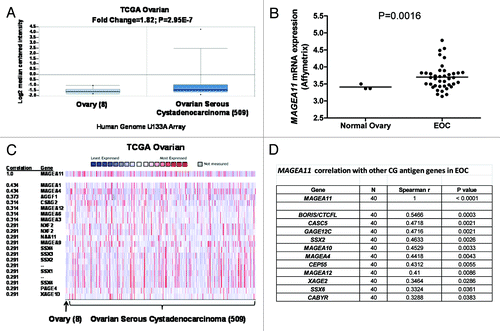
Figure 3.MAGEA11 promoter methylation and expression in prostate cancer and EOC. (A) Sodium bisulfite clonal sequencing of the MAGEA11 promoter region was performed on the indicated cell lines. The transcriptional start site (TSS), as determined by RLM-RACE, is indicated by the right broken arrow, and the coordinates of the analyzed region are shown in the upper left panel. Filled and open circles indicate methylated and unmethylated CpG sites, respectively, and each row represents one sequenced allele. The red box indicates three TSS-adjacent CpG sites. (B) Summary of MAGEA11 bisulfite sequencing and mRNA expression data in prostate cell lines. Methylation percentages for the entire MAGEA11 5′ CpG island (CGI) or for the three TSS-resident CpGs were calculated from (A), and MAGEA11 expression was determined by RT-qPCR. (C) MAGEA11 promoter methylation and mRNA expression in one normal ovary (NO) and four EOC samples were determined using bisulfite clonal sequencing (> 10 alleles), and Affymetrix microarray, respectively. (D) MAGEA11 mRNA expression indirectly correlates with MAGEA11 TSS methylation in EOC. MAGEA11 expression and methylation of three TSS-resident CpG sites in 16 EOC samples was determined by RT-qPCR and bisulfite pyrosequencing, respectively. Five samples that did not express measurable MAGEA11 are plotted on the x-axis. Spearman test results are shown.
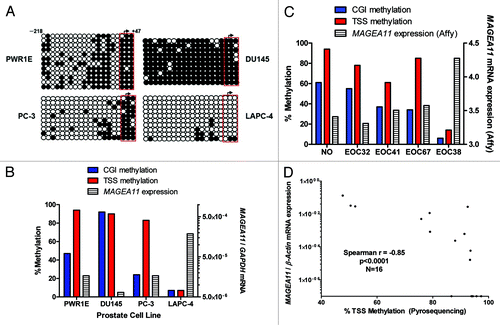
Figure 4.MAGEA11 expression and methylation and global DNA methylation. (A) MAGEA11 expression and LINE1 methylation in human prostate cell lines. MAGEA11 expression was determined by RT-qPCR and LINE1 methylation was determined by pyrosequencing. PWR-1E and RWPE-2 are derived from normal prostate epithelium, while other cell lines are derived from prostate cancer. Spearman test showed an inverse association between MAGEA11 expression and LINE1 methylation, which did not reach statistical significance (R = -0.455, p = 0.267). (B) MAGEA11 expression and LINE1 methylation in primary prostate tissues. Measurements were determined as described in (A). (C) MAGEA11 expression and LINE1 methylation in normal ovary and EOC with divergent LINE1 methylation. MAGEA11 expression and LINE1 methylation were determined as described in (A). MAGEA11 expression is plotted on a log axis and note that five samples in the hypermethylated EOC group did not express measurable MAGEA11. The mean LINE1 methylation level in three sample groups is shown below the x-axis. Two-tailed t-test results are shown. (D) MAGEA11 expression and LINE1 methylation are indirectly associated in EOC. MAGEA11 expression was plotted vs. LINE1 methylation in EOC samples from both EOC groups shown in (C). Spearman test results are shown. (E) MAGEA11 TSS methylation and LINE1 methylation are directly associated in prostate cancer. Methylation was determined using bisulfite sequencing (MAGEA11) and pyrosequencing (LINE-1). Spearman test results are shown. (F) MAGEA11 TSS methylation and LINE1 methylation are directly associated in EOC. Methylation was determined using pyrosequencing. Spearman test results are shown.
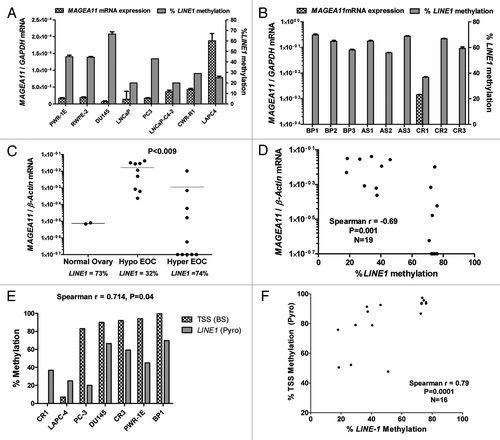
Figure 5. Epigenetic modulatory drugs induce MAGEA11 expression. MAGEA11 expression was measured by RT-qPCR following treatment of benign prostate or prostate cancer cell lines with vehicle (PBS/DMSO), Trichostatin A (TSA), and/or decitabine (DAC), as described in Materials and Methods. (A) DU145 cells. (B) PC-3 cells. (C) LAPC-4 cells. (D) PWR-1E cells. We noted that the MAGEA11/GAPDH copy number in control LAPC-4 cells appeared substantially lower than observed in other experiments, likely due to repression by DMSO. This effect was also observed in .
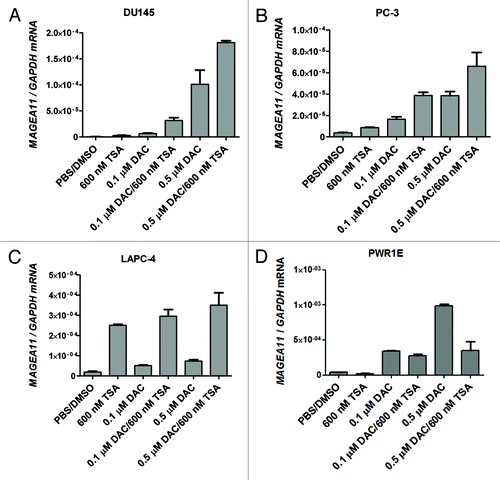
Figure 6.MAGEA11 promoter activity and repression by DNA methylation. (A) Diagram of the MAGEA11 5′ region and MAGEA11 promoter luciferase constructs. The MAGEA11 promoter region, TSS, first part of exon I (gray box), and the CpG island (CGI) are indicated. Four promoter constructs were generated by PCR (C1-C4). The key indicates the location of CpG sites, Ets sites (which correspond to HpaII sites), the Sp1 site cluster, and the three TSS-resident CpG sites examined by bisulfite pyrosequencing. (B) C1-C4 constructs were transfected into the indicated prostate cancer cell lines, and promoter activity was measured. Cells treated with the transfection reagent alone served as a negative control. (C) Sequence of the two Ets sites and the Sp1 site cluster in the MAGEA11 promoter. CpG dinucleotides are indicated with red font. The two consensus Ets sites each contain an HpaII recognition sequence (5′-CCGG-3′). The Sp1 cluster contains 10 embedded CpG sites. (D) Confirmation of the methylation status of MAGEA11 promoter construct inserts. Inserts were mock-methylated (M), methylated with HpaII (H), or with M.SssI (S). Methylation status was verified by digestion with HpaII restriction endonuclease (top panel) or McrBc endonuclease (bottom panel). The sequence specificity of each nuclease is shown at left. (E) MAGEA11 promoter repression by methylation. Inserts verified as shown in (C) were ligated into the pGL3-basic vector, transfected into PC-3 cells, and promoter activity was measured. The number of HpaII and M.SssI sites in each construct is indicated below the graph.
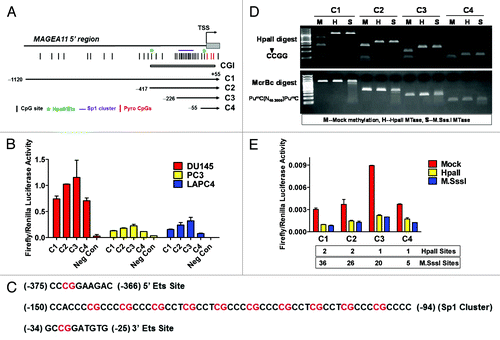
Figure 7. Sp1 contributes to MAGEA11 promoter activity and gene expression. (A) Sp1 protein expression was determined by western blot analysis of the indicated cell lines. C and N refer to cytosolic and nuclear extracts, respectively. (B) Mithramycin A (MitA) treatment reduces MAGEA11 promoter activity. LAPC-4 cells were simultaneously transfected with the C3 construct and treated with DMSO (vehicle) or the indicated concentrations of MitA. Cell extracts were harvested 24 h post-treatment and used for luciferase assay. (C) MitA treatment represses MAGEA11 mRNA expression. LAPC-4 cells were treated with DMSO or MitA for 24 h, and RNA extracts were used to measure MAGEA11 expression by RT-qPCR. (D) MitA treatment suppresses decitabine-mediated MAGEA11 induction. PC-3 cells were treated with decitabine (DAC) and/or MitA alone or in combination. RNA extracts were harvested five days after initiation of treatment, and were used to measure MAGEA11 expression by RT-qPCR. (E) Sp1 knockdown in LAPC-4 cells. LAPC-4 cells were transfected with two different Sp1 targeting siRNAs, or with a control non-targeting siRNA, once daily for 48 h. 48 h post-treatment, whole cell extracts were prepared and used for western blot analysis. (F) Sp1 knockdown reduces MAGEA11 expression. LAPC-4 cells were treated as described in (E), and RNA extracts were prepared 48 h post treatment and used for RT-qPCR analysis of MAGEA11.
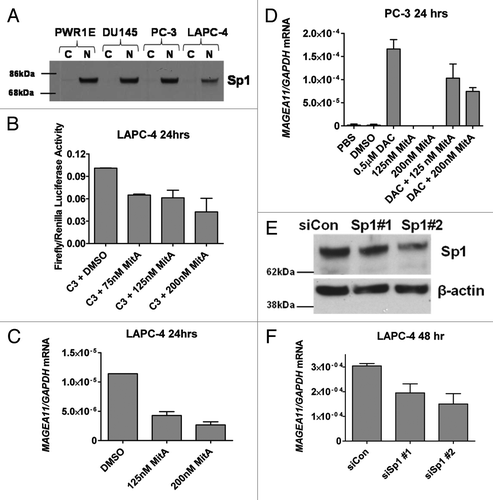
Figure 8. MAPit analysis of MAGEA11 promoter nucleosome occupancy. MAPit data were analyzed using MethylViewerCitation37. Each row indicates one individual sequenced allele, and the approximate nucleotide coordinates in relation to the TSS are indicated below each data panel. The key to symbols used is shown at top. The areas highlighted orange indicate CviP1-accessible regions (e.g., nucleosome-free regions) and were defined according to the “3 + 2 rule,” i.e., regions of three consecutive G-m5C sites broken by two consecutive GC sites. The vertical magenta lines delineate the termini of the region analyzed by traditional bisulfite clonal sequencing in Supplemental Figure 2 (for HCT116 and DKO) and (for PC-3). (A) HCT116 cells. (B) DKO cells. (C) PC-3 cells.
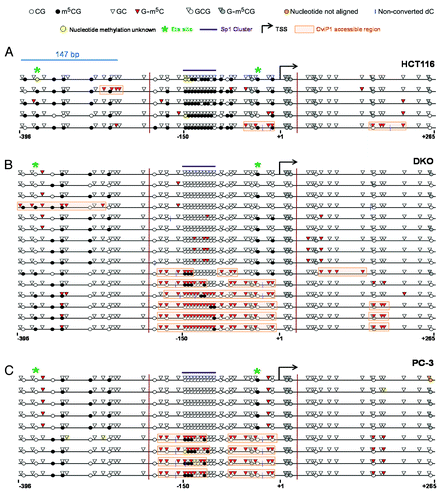
Figure 9.MAGEA11 gene regulation in human cancer. (A) Flowchart of events involved in the activation of MAGEA11 expression in cancer. (B) Schematic of MAGEA11 promoter configuration in the fully repressed (top) and fully activated states (bottom). Open and filled lollipops indicate unmethylated and methylated CpG sites, respectively. The red outlined lollipop corresponds to the 3′ Ets site. Ovals indicate nucleosomes, with numbers below each indicating the nucleosome position relative to the MAGEA11 TSS. Right bent arrow indicates TSS. Purple lines indicate histone H3 tails. Ac indicates acetylation.