1,104
Views
31
CrossRef citations to date
0
Altmetric
Research Paper

Quantitative DNA methylation analysis improves epigenotype-phenotype correlations in Beckwith-Wiedemann syndrome

, , , , , , , , , , , , , , & show all
Pages 1053-1060 | Received 12 Jun 2013, Accepted 18 Jul 2013, Published online: 05 Aug 2013

Figures & data

Table 1. Clinical features and methylation values of ICR1 and ICR2 in the postnatal cases

Figure 1. Distribution of ICR1 and ICR2 methylation values in the control population (A) and postnatal BWS cases (B). Vertical (ICR1) and horizontal (ICR2) lines define the threshold levels of normal methylation values. The cases (▲) with mild ICR1 hypermethylation associated with abdominal wall defects (umbilical hernia or diastasis recti), but not with omphalocele, are encircled by a solid line. The cases (▲) with severe ICR1 hypermethylation associated with macroglossia, macrosomia, and visceromegaly are encircled by a dotted line. Cases with ICR2 hypomethylation (♦). Cases with both ICR1 and ICR2 methylation anomalies, indicating UPD ()
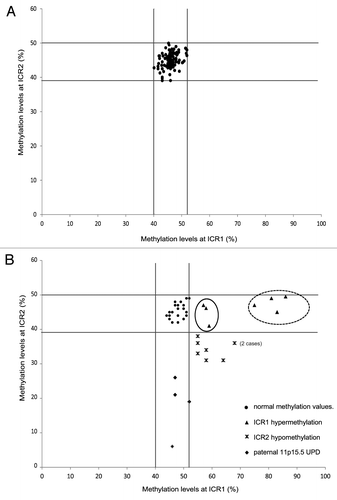
Figure 1. Distribution of ICR1 and ICR2 methylation values in the control population (A) and postnatal BWS cases (B). Vertical (ICR1) and horizontal (ICR2) lines define the threshold levels of normal methylation values. The cases (▲) with mild ICR1 hypermethylation associated with abdominal wall defects (umbilical hernia or diastasis recti), but not with omphalocele, are encircled by a solid line. The cases (▲) with severe ICR1 hypermethylation associated with macroglossia, macrosomia, and visceromegaly are encircled by a dotted line. Cases with ICR2 hypomethylation (♦). Cases with both ICR1 and ICR2 methylation anomalies, indicating UPD ()

Table 2. : Percentage levels of ICR1 and ICR2 methylation in controls and cases

Figure 2. Frequencies of the different methylation defects (ICR1 hypermethylation, ICR2 hypomethylation, and both ICR1 and ICR2 methylation anomalies) in the cohort of the current study (left) and in cohorts of previous studies (http://www.ncbi.nlm.nih.gov/books/NBK1394/#bws.Summary) (right).
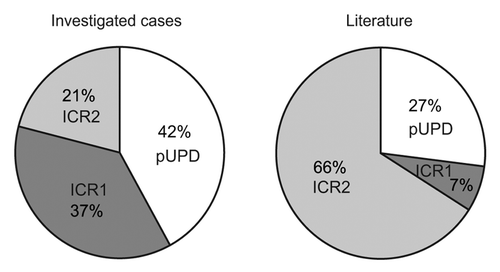
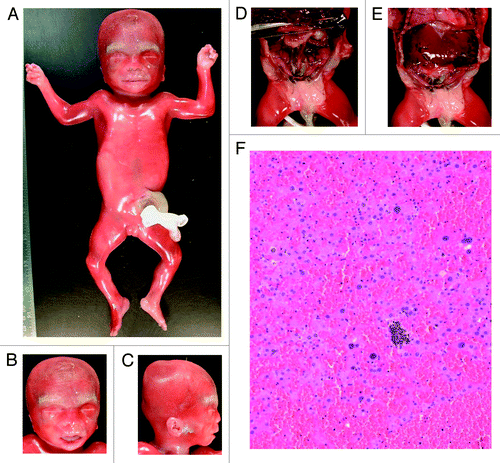
Figure 2. Frequencies of the different methylation defects (ICR1 hypermethylation, ICR2 hypomethylation, and both ICR1 and ICR2 methylation anomalies) in the cohort of the current study (left) and in cohorts of previous studies (http://www.ncbi.nlm.nih.gov/books/NBK1394/#bws.Summary) (right).

Table 3. Descriptions of the three prenatal cases with suspected BWS

Figure 3. Autopsy of prenatal case F1. Hypertrophy of the labia majora (A), macroglossia (B), ear anomalies (C), visceromegaly with hepatomegaly, nephromegaly, and ovarian hypertrophy (D and E), and adrenocortical cytomegaly (F).

Figure 3. Autopsy of prenatal case F1. Hypertrophy of the labia majora (A), macroglossia (B), ear anomalies (C), visceromegaly with hepatomegaly, nephromegaly, and ovarian hypertrophy (D and E), and adrenocortical cytomegaly (F).
Supplemental material

Additional material

Download Zip (114.5 KB)