Figures & data
Figure 1. Cytosine derivatives and demethylation patterns. (A) The entire cytosine conversion cycle comprising of 5mC/5hmC/5fC/5caC, and final base excision repair (BER) are serially catalyzed by DNMTs, TETs and TDG enzymes. Although other dehydroxymethylation pathways have been proposed (deaminating 5hmC to 5hmU and then through BER by TDG/SMUG), TETs mediated oxidation is the only biochemically confirmed in mammalian cells by in vivo experiments. (B) Passive demethylation (induced by Decitabine) and active demethylation (induced by hypoxia) with the involvement of MBD3. The incorporation of Decitabine molecule depends on DNA replication and the incorporation of this analog accelerates the passive dilution of cytosine modifications, since its 5th nitrogen is not an accessible DNMTs substrate. On the other hand, the local physical and chemical environment (e.g., pH, ion concentration, ROS molecule etc.) or protein-DNA conformation, under hypoxic stress, would experience considerable changes to weaken the binding affinity between MBD3 and DNA, or even cause MBD3 detachment. The decrease in steric hindrance between MBD3 and the binding site could facilitate the involvement of TETs in further demethylation, which is DNA replication independent.
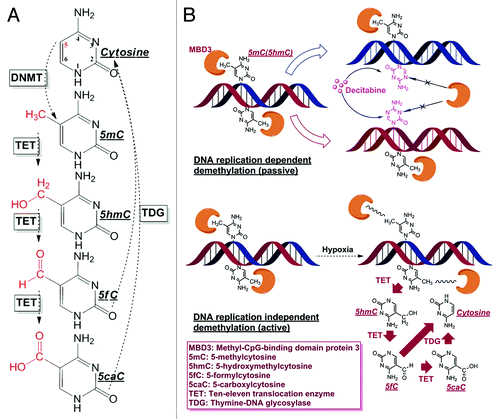
Figure 2. Reductions of 5mC and 5hmC induced under different conditions. (A) Improved ELISA-based immunoassay quantified the genomic contents of 5mC and 5hmC. Significant decrease in both the cytosine derivatives can be noted within the Decitabine and Hypoxia treated groups. Each data column was averaged from triplicate measurements and the experiments were replicated another two times (data not shown). (B) Immunofluorescence staining of 5mC and 5hmC further confirmed the demethylation effect in 4% paraformaldehyde fixed cells. ImageJ 3D plugin was used to visualize the signal intensity in arbitrary units based on the 8-bit intensity scale (0–255). Image scale bar: 10 μm.
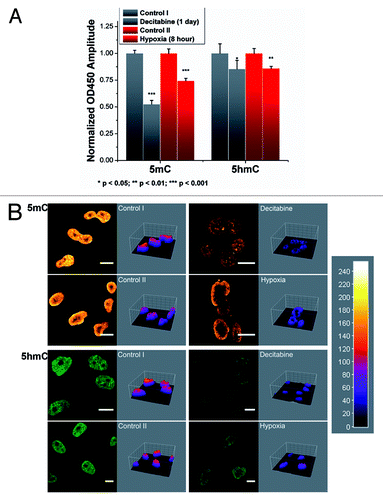
Figure 3. MBD3 tends to detach from DNA substrate and diffuse more freely under active demethylation, but retains its binding affinity with DNA under passive demethylation as concluded from FCS measurement and mathematical fitting. (A) Transfection of a low amount of pGFP-MBD3 recombinant protein and representative FCS data collection at different points (red crosses) from different cellular compartments and treatment conditions. For FCS, data from each cell was measured 2–3 times and averaged. (B) Distinguishable autocorrelation curves fitted by single-component diffusion model (left panel) indicated free MBD3 diffusion in the cytoplasm but restricted diffusion in the nucleus, and faster intranuclear diffusion after hypoxia treatment rather than Decitabine treatment, all of which were simultaneously analyzed by MEMFCS algorithm fitting (right panel). (C) Summarized statistics of diffusion time. Raw data were collected from more than 15 cells for each set. Mean value is presented along with the SEM. Statistical analysis was conducted with the Student t–test by Origin8.5 software package.
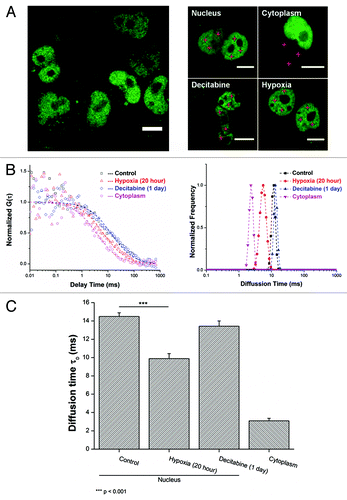
Figure 4. Time-course response of MBD3 under hypoxic conditions in sensitive and insensitive cells. (A) The mobility of MBD3 protein could facilitate recognizing a heterogeneous cellular response to hypoxia (left panel) with distinct change in diffusion patterns (right panel). (B) In the first 8 h of hypoxia a considerable number of hypoxia-sensitive cells experiencing significant demethylation were noted as reflected by the detachment of MBD3 from the DNA (τD < 5 ms). After 8 to16 h, the proportion of sensitive cells and the corresponding τD counts decreased from about 30% to 10% (inset panel). The gradually accelerated mobility of MBD3 in hypoxia-insensitive cells was found to be dominant.
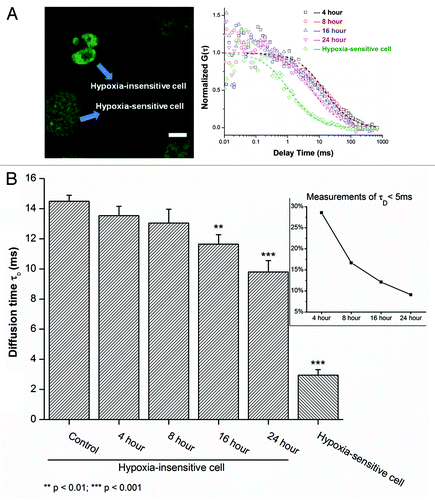
Figure 5. Concurrent decrease in 5fC and 5caC with 5hmC due to hypoxia induced active demethylation. (A) Stacked quantitative curves of 5mC, 5hmC, 5fC and 5caC; the simultaneous decrease in 5hmC, 5fC and 5caC is indicative of the TETs mediated active demethylation pathway (). (B) Absolute quantities of 5mC and 5hmC calculated from standard curve (Fig. S2B) indicated two main reduction periods within 24 h: in the first 8 h and from 16 to 24 h. The plateau period from 8 to 16 h, in terms of 5hmC, 5fC and 5caC changes, represents the gradual transition of the contribution of ensemble demethylation from sensitive to insensitive cells. Two-sample t-test was conducted to compare each neighboring time point.
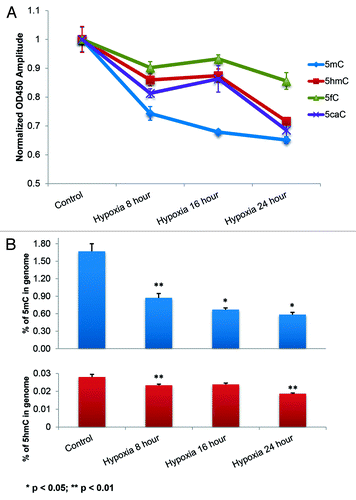
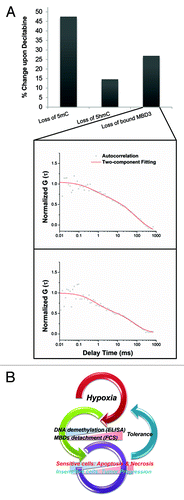
Figure 6. (A) The putative validation of the main MBD3-GFP in vivo binding target by FCS. Upon Decitabine treatment, redundantly expressed MBD3-GFP showed two diffusing components and the loss of bound-component was positively correlated with the loss of 5mC and 5hmC. (B) Overview of the influence of hypoxia on DNA methylation and fate of tumor cell.