Figures & data
Table 1. Demographics and study variables
Table 2. Hierarchical linear regression predicting newborn neurobehavior at birth
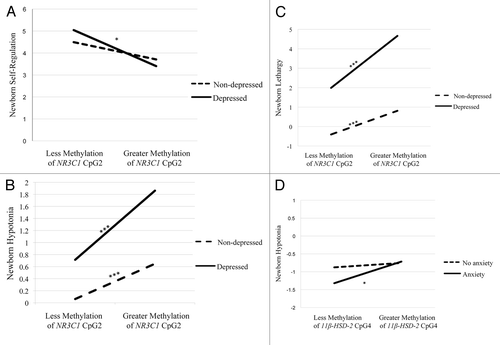
Figure 1. Interactions between maternal depression during pregnancy and NR3C1 CpG2 on newborn self-regulation (A), hypotonia (B), and lethargy (C), and the interaction between maternal anxiety during pregnancy and 11βHSD-2 CpG4 methylation on newborn hypotonia (D). Simple slopes were tested at ± 1 SD from the mean (A, D), or 1 SD and 2 SD above the mean (B, C). * P < 0.05; ** P < 0.01; *** P < 0.001.