762
Views
1
CrossRef citations to date
0
Altmetric
Research Paper

Characterization of a Brg1 hypomorphic allele demonstrates that genetic and biochemical activity are tightly correlated

, , &
Pages 249-256 | Received 19 Aug 2013, Accepted 18 Oct 2013, Published online: 29 Oct 2013

Figures & data

Figure 1. The Brg1ENU1/ENU1 phenotype. (A) Percentage of ENU1/ENU1 homozygotes at the perinatal stage and weaning arising from intercrosses. Data are based on 195 progeny from 24 litters of intercrosses. Compared with the expected Mendelian ratio of 25%, the results are not statistically significant (n.s.) at perinatal stage but significant (*P < 0.05) at weaning. (B) Kaplan–Meier survival curve of controls (+/+ and +/ENU1) and mutants (ENU1/ENU1). Data are based on the same 195 progeny as presented in panel A. *P < 0.05. (C) Body weights of progeny from intercrosses at weaning. Data are based on 84 weanlings from 12 litters. Squares, males; Circles, females; White, controls (+/+ or ENU1/+); Black, mutants (ENU1/ENU1). Mean weights for each class are indicated at the top with significant differences noted (*P < 0.05). (D) Hematocrits of control and mutant progeny at weaning. Data are from 5 biological replicates of each class and are presented as mean ± SE. Differences are not statistically significant (n.s.).
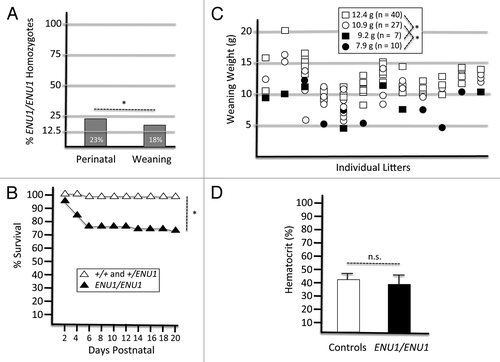
Figure 1. The Brg1ENU1/ENU1 phenotype. (A) Percentage of ENU1/ENU1 homozygotes at the perinatal stage and weaning arising from intercrosses. Data are based on 195 progeny from 24 litters of intercrosses. Compared with the expected Mendelian ratio of 25%, the results are not statistically significant (n.s.) at perinatal stage but significant (*P < 0.05) at weaning. (B) Kaplan–Meier survival curve of controls (+/+ and +/ENU1) and mutants (ENU1/ENU1). Data are based on the same 195 progeny as presented in panel A. *P < 0.05. (C) Body weights of progeny from intercrosses at weaning. Data are based on 84 weanlings from 12 litters. Squares, males; Circles, females; White, controls (+/+ or ENU1/+); Black, mutants (ENU1/ENU1). Mean weights for each class are indicated at the top with significant differences noted (*P < 0.05). (D) Hematocrits of control and mutant progeny at weaning. Data are from 5 biological replicates of each class and are presented as mean ± SE. Differences are not statistically significant (n.s.).

Table 1.Brg1 allelic series confers a range of genetic activities

Figure 2. The BRG1 E1083G protein is stable and has full ATPase activity. (A) Western blot analysis of several organs from +/+ controls and ENU1/ENU1 mutants. Top panel, BRG1 immunoblot; bottom panel, β-actin immunoblot. (B) Representative image of TLC autoradiograph containing ATPase reactions at different time points. 32P-labeled γATP and hydrolyzed inorganic phosphate (Pi) are indicated. (C) Percentage of ATP hydrolyzed by wild type and E1083G mutant BRG1 proteins in the presence or absence of DNA. Each value represents the mean ± SE from 3 independent experiments. Differences between wild type and mutant samples are not significant.
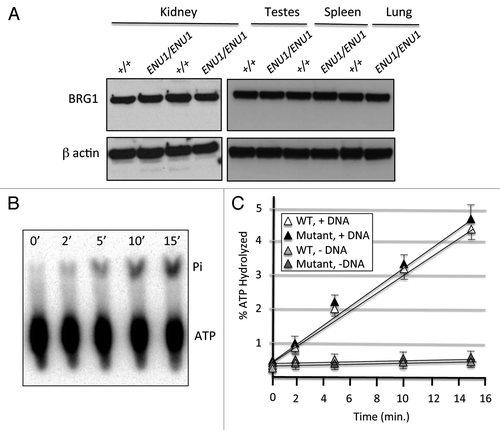
Figure 2. The BRG1 E1083G protein is stable and has full ATPase activity. (A) Western blot analysis of several organs from +/+ controls and ENU1/ENU1 mutants. Top panel, BRG1 immunoblot; bottom panel, β-actin immunoblot. (B) Representative image of TLC autoradiograph containing ATPase reactions at different time points. 32P-labeled γATP and hydrolyzed inorganic phosphate (Pi) are indicated. (C) Percentage of ATP hydrolyzed by wild type and E1083G mutant BRG1 proteins in the presence or absence of DNA. Each value represents the mean ± SE from 3 independent experiments. Differences between wild type and mutant samples are not significant.

Figure 3. The BRG1 E1083G protein has a significant reduction in nucleosome-remodeling activity. (A) BRG1-dependent remodeling facilitates Pst1 cleavage of the TPT nucleosomal substrate. (B) Pst1 restriction enzyme accessibility assays were performed with wild type, E1083G, and K798R BRG1 protein in the presence of ATP or non-hydrolyzable ATPγS. The K798R is an “ATPase-dead” that served as a negative control. ATP-containing reactions were quenched at various time points (0.25–60 min), whereas ATPγS containing reactions were incubated for the entire 60 min time course. Shown are images of the same gel from two separate exposures. (C) Band densitometry measurements were used to calculate the fraction of uncut TPT fragments at each time point. (D) Relative remodeling activity of wild-type (set at 1) vs. mutant E1083G BRG1 (0.55) based on fraction of uncut TPT nucleosomal template. Histograms represent mean ± SE based on 3 independent experiments with significant difference noted.
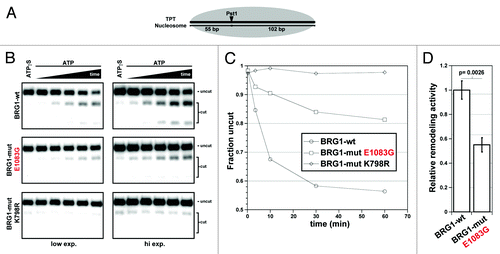
Figure 3. The BRG1 E1083G protein has a significant reduction in nucleosome-remodeling activity. (A) BRG1-dependent remodeling facilitates Pst1 cleavage of the TPT nucleosomal substrate. (B) Pst1 restriction enzyme accessibility assays were performed with wild type, E1083G, and K798R BRG1 protein in the presence of ATP or non-hydrolyzable ATPγS. The K798R is an “ATPase-dead” that served as a negative control. ATP-containing reactions were quenched at various time points (0.25–60 min), whereas ATPγS containing reactions were incubated for the entire 60 min time course. Shown are images of the same gel from two separate exposures. (C) Band densitometry measurements were used to calculate the fraction of uncut TPT fragments at each time point. (D) Relative remodeling activity of wild-type (set at 1) vs. mutant E1083G BRG1 (0.55) based on fraction of uncut TPT nucleosomal template. Histograms represent mean ± SE based on 3 independent experiments with significant difference noted.

Figure 4. Structural importance of the E1083 residue. (A) Human (h) BRG1 Uniprot motifs. Roman numerals and dotted lines denote helicase-like motifs. (B) Superimposition of two 3D protein homology models of human BRG1 ATPase chromatin-remodeling domain. (C) Structural annotation lobe 2 domains. Domain features are color-coded to match the stick diagram of BRG1 in panel A. The E1083 residue lies within the HD2-HelC helix (yellow). (D) Multiple sequence alignment of hBRG1, Saccharomyces cerevisiae (sc) CHD1, and zebrafish (z) RAD54L peptides containing the E1083 residue. Protein homology secondary structure predictions of the hBRG1 peptide compared with the known structures of scCHD1 and zRAD54L peptides are annotated below the alignment. (E) Predicted helicity plot of residues contained within the hBRG1 peptide shown in D.
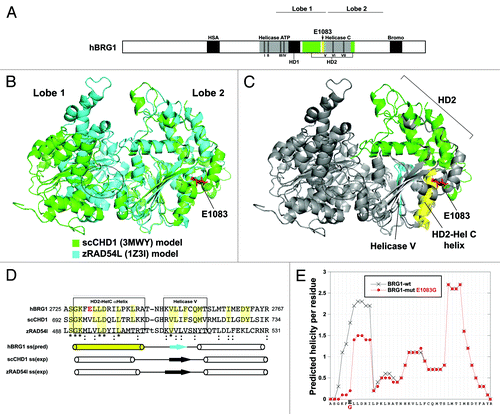
Figure 4. Structural importance of the E1083 residue. (A) Human (h) BRG1 Uniprot motifs. Roman numerals and dotted lines denote helicase-like motifs. (B) Superimposition of two 3D protein homology models of human BRG1 ATPase chromatin-remodeling domain. (C) Structural annotation lobe 2 domains. Domain features are color-coded to match the stick diagram of BRG1 in panel A. The E1083 residue lies within the HD2-HelC helix (yellow). (D) Multiple sequence alignment of hBRG1, Saccharomyces cerevisiae (sc) CHD1, and zebrafish (z) RAD54L peptides containing the E1083 residue. Protein homology secondary structure predictions of the hBRG1 peptide compared with the known structures of scCHD1 and zRAD54L peptides are annotated below the alignment. (E) Predicted helicity plot of residues contained within the hBRG1 peptide shown in D.
Supplemental material

Additional material

Download Zip (2.6 MB)

Reprints and Corporate Permissions

Please note: Selecting permissions does not provide access to the full text of the article, please see our help page How do I view content?

To request a reprint or corporate permissions for this article, please click on the relevant link below:

Academic Permissions

Please note: Selecting permissions does not provide access to the full text of the article, please see our help page How do I view content?

Obtain permissions instantly via Rightslink by clicking on the button below:

If you are unable to obtain permissions via Rightslink, please complete and submit this Permissions form. For more information, please visit our Permissions help page.