1,245
Views
15
CrossRef citations to date
0
Altmetric
Research Paper

RevSex duplication-induced and sex-related differences in the SOX9 regulatory region chromatin landscape in human fibroblasts

, , , , , & show all
Pages 416-427 | Received 06 Oct 2013, Accepted 09 Dec 2013, Published online: 18 Dec 2013

Figures & data

Figure 1. An UCSC genome browser panel with custom tracks showing the differences in H3K4me3 (top), H3K27me3 (middle) and H3K9me3 (bottom) chromatin profiles between the 46,XX ovotesticular DSD male and his father in the area containing the RevSex duplication (marked with a black line). The curve displays the ChIP-on-chip signal of the index case after subtraction of the signal of his XY-father. The red lines mark the position of predicted SRY and SOX9 binding sites (“HMR Conserved Transcription Factor Binding Sites”), all with high Z-scores for SRY binding: 3.29 for SRY-1 and 3.13 for SRY-2. SRY-2 had in addition a high degree of genomic sequence conservation beyond the human/mouse/rat comparison that the Z-score calculations are based on; See the UCSC browser “Vertebrate Multiz Alignment & Conservation (46 Species)” track for details. A position of difference commented in the text is marked with “A.”
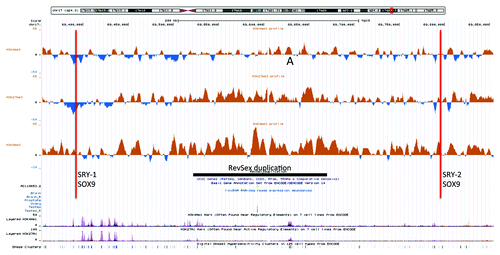
Figure 1. An UCSC genome browser panel with custom tracks showing the differences in H3K4me3 (top), H3K27me3 (middle) and H3K9me3 (bottom) chromatin profiles between the 46,XX ovotesticular DSD male and his father in the area containing the RevSex duplication (marked with a black line). The curve displays the ChIP-on-chip signal of the index case after subtraction of the signal of his XY-father. The red lines mark the position of predicted SRY and SOX9 binding sites (“HMR Conserved Transcription Factor Binding Sites”), all with high Z-scores for SRY binding: 3.29 for SRY-1 and 3.13 for SRY-2. SRY-2 had in addition a high degree of genomic sequence conservation beyond the human/mouse/rat comparison that the Z-score calculations are based on; See the UCSC browser “Vertebrate Multiz Alignment & Conservation (46 Species)” track for details. A position of difference commented in the text is marked with “A.”

Table 1. Selected methylation values of the SOX9 regulatory region in RevSex duplication carriers (the XX-DSD index case and his father) compared with an average of male (n = 5) and female (n = 4) controls

Figure 2. An UCSC genome browser panel with custom tracks displaying the differences in H3K4me3 (top), H3K27me3 (middle) and H3K9me3 (bottom) chromatin profiles between the XX-DSD male and his XY-father in a small region 158 kb downstream of the RevSex duplication containing a transcription factor/CTCF binding sites (UCSC genome browser track “HMR Conserved Transcription Factor Binding Sites”) called DMR2 in and marked B in the figure. The upstream binding site (red line) corresponds to a DNaseI hypersensitivity site and is also predicted to bind SRY and SOX9 (corresponds to the SRY-2/SOX9 site in ). The downstream binding site (green line) contains a CTCF binding site (ENCODE immunoprecipitation data) and a putative SRY binding site 3 kb downstream. It is important to note that SRY and SOX9 binding sites are computationally predicted based on human, mouse and rat conservation of binding sites as described in the Transfac database and have not been validated experimentally (see UCSC genome browser table “HMR Conserved Transcription Factor Binding Sites” description for more details).
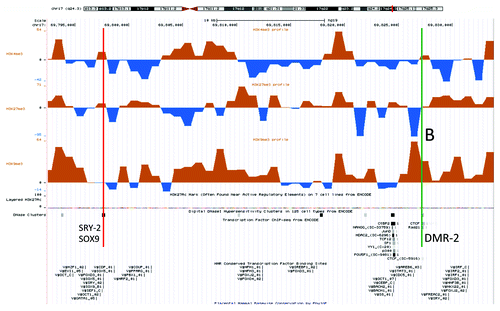
Figure 2. An UCSC genome browser panel with custom tracks displaying the differences in H3K4me3 (top), H3K27me3 (middle) and H3K9me3 (bottom) chromatin profiles between the XX-DSD male and his XY-father in a small region 158 kb downstream of the RevSex duplication containing a transcription factor/CTCF binding sites (UCSC genome browser track “HMR Conserved Transcription Factor Binding Sites”) called DMR2 in Table 1 and marked B in the figure. The upstream binding site (red line) corresponds to a DNaseI hypersensitivity site and is also predicted to bind SRY and SOX9 (corresponds to the SRY-2/SOX9 site in Fig. 1). The downstream binding site (green line) contains a CTCF binding site (ENCODE immunoprecipitation data) and a putative SRY binding site 3 kb downstream. It is important to note that SRY and SOX9 binding sites are computationally predicted based on human, mouse and rat conservation of binding sites as described in the Transfac database and have not been validated experimentally (see UCSC genome browser table “HMR Conserved Transcription Factor Binding Sites” description for more details).

Figure 3. A UCSC genome browser panel with custom tracks displaying the signal-to-input chromatin profiles (H3K4me3, H3K27me3, and H3K9me3) of the XX-DSD case (upper profiles) compared with his RevSex duplication-carrier father (lower profiles) in the area from SOX9 and 120 kb upstream (70 000–70 126 kb from 17pter, hg19). The red line called TESCO corresponds to the position of the TESCO-ECR (70 103 197–70 103 373 bp from 17pter, hg19), the green line marked C to DMR3 in , and the dashed line the start of the SOX9 gene. The same position marks and more detailed explanations can be found in .
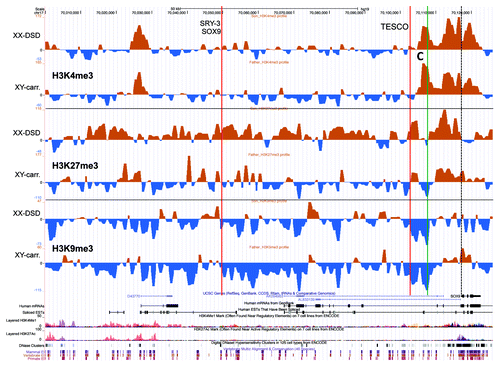
Figure 3. A UCSC genome browser panel with custom tracks displaying the signal-to-input chromatin profiles (H3K4me3, H3K27me3, and H3K9me3) of the XX-DSD case (upper profiles) compared with his RevSex duplication-carrier father (lower profiles) in the area from SOX9 and 120 kb upstream (70 000–70 126 kb from 17pter, hg19). The red line called TESCO corresponds to the position of the TESCO-ECR (70 103 197–70 103 373 bp from 17pter, hg19), the green line marked C to DMR3 in Table 1, and the dashed line the start of the SOX9 gene. The same position marks and more detailed explanations can be found in Figure 5.

Figure 4. An UCSC genome browser panel with custom tracks showing the average signal-to-input chromatin profiles (H3K4me3, H3K27me3, and H3K9me3) of control females (upper profiles, n = 3) and control males (lower profiles, n = 3) in the 736 kb region from 69,390,000 to 70,126,000 (hg19) after 1 kb binning of data. A, C, and D mark positions of differences commented in the text. The dashed line marks the start of the SOX9 gene.
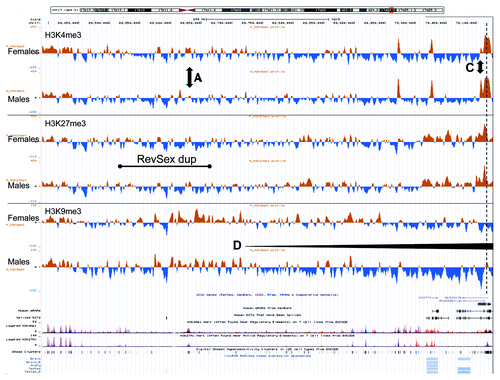
Figure 4. An UCSC genome browser panel with custom tracks showing the average signal-to-input chromatin profiles (H3K4me3, H3K27me3, and H3K9me3) of control females (upper profiles, n = 3) and control males (lower profiles, n = 3) in the 736 kb region from 69,390,000 to 70,126,000 (hg19) after 1 kb binning of data. A, C, and D mark positions of differences commented in the text. The dashed line marks the start of the SOX9 gene.

Table 2. Male/female difference: Average male H3 chromatin profiles (n = 3) subtracted by average female H3 chromatin profiles (n = 3)

Figure 5. An UCSC genome browser panel with custom tracks displaying the difference between control male (n = 3) and control female (n = 3) chromatin profiles of the part SOX9 locus from the gene itself and 120 kb upstream (70,000 – 70,126 kb from 17pter, hg19). The profiles shown are H3K4me3 (top), H3K27me3 (middle), and H3K9me3 (bottom). The red line called TESCO marks the position of the TESCO-ECR (70,103,197–70,103,373 bp from 17pter, hg19) and the green line the position of DMR3 in . The predicted SRY-3/SOX9 binding site had a Z-score of 3.45 for SOX9 and 2.41 for SRY, while the TESCO enhancer had a Z-score of 2.58 for SOX9 and 2.66 for SRY (UCSC, “HMR Conserved Transcription Factor Binding Sites”). In addition, the TESCO enhancer had a high degree of genomic sequence conservation beyond the human/mouse/rat comparison used to calculate the Z-score (UCSC, “Vertebrate Multiz Alignment & Conservation (46 Species)”). The TESCO SRY binding site has been experimentally verified.Citation31
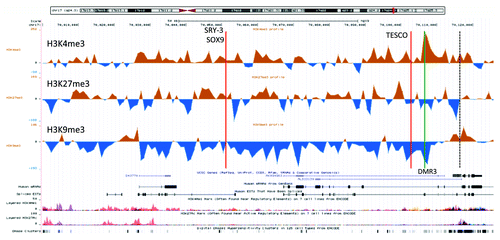
Figure 5. An UCSC genome browser panel with custom tracks displaying the difference between control male (n = 3) and control female (n = 3) chromatin profiles of the part SOX9 locus from the gene itself and 120 kb upstream (70,000 – 70,126 kb from 17pter, hg19). The profiles shown are H3K4me3 (top), H3K27me3 (middle), and H3K9me3 (bottom). The red line called TESCO marks the position of the TESCO-ECR (70,103,197–70,103,373 bp from 17pter, hg19) and the green line the position of DMR3 in Table 1. The predicted SRY-3/SOX9 binding site had a Z-score of 3.45 for SOX9 and 2.41 for SRY, while the TESCO enhancer had a Z-score of 2.58 for SOX9 and 2.66 for SRY (UCSC, “HMR Conserved Transcription Factor Binding Sites”). In addition, the TESCO enhancer had a high degree of genomic sequence conservation beyond the human/mouse/rat comparison used to calculate the Z-score (UCSC, “Vertebrate Multiz Alignment & Conservation (46 Species)”). The TESCO SRY binding site has been experimentally verified.Citation31

Figure 6. A schematic drawing of our major findings: In females the RevSex duplication (black line, region A) has more repressive chromatin with a more “active” putative enhancer element (orange dot) than in males. In the XX-DSD case similar findings are done with the exception of a more “open” SOX9 enhancer/promoter (region C). In males a downstream CTCF binding site is enriched in H3K27me3 (PRC2-related) chromatin compared with females (region B), and the SOX9 enhancer/promoter region (region C) is more open (red dot). This region is even more open in the XY RevSex carrier (orange dot). On the right side a comparison of the DMR3 H3K4me3 peaks (region C) can be seen with internal comparisons to the H3K4me3 peaks of the SOX9 promoter with peak ratios shown on the right. Chromatin color codes are follows: black, H3K9me3; blue, H3K27me3; red, H3K4me3; orange, stronger H3K4me3.
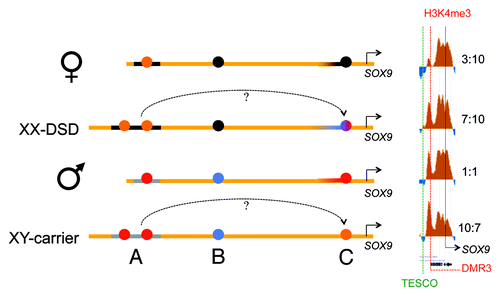
Figure 6. A schematic drawing of our major findings: In females the RevSex duplication (black line, region A) has more repressive chromatin with a more “active” putative enhancer element (orange dot) than in males. In the XX-DSD case similar findings are done with the exception of a more “open” SOX9 enhancer/promoter (region C). In males a downstream CTCF binding site is enriched in H3K27me3 (PRC2-related) chromatin compared with females (region B), and the SOX9 enhancer/promoter region (region C) is more open (red dot). This region is even more open in the XY RevSex carrier (orange dot). On the right side a comparison of the DMR3 H3K4me3 peaks (region C) can be seen with internal comparisons to the H3K4me3 peaks of the SOX9 promoter with peak ratios shown on the right. Chromatin color codes are follows: black, H3K9me3; blue, H3K27me3; red, H3K4me3; orange, stronger H3K4me3.
Supplemental material

Additional material

Download Zip (1,023.4 KB)