Figures & data
Figure 1. Ratio of average methylation in LINE regions to average methylation of the total genome (average methylation defined as fraction of CpG sites with methylation > 0.5).
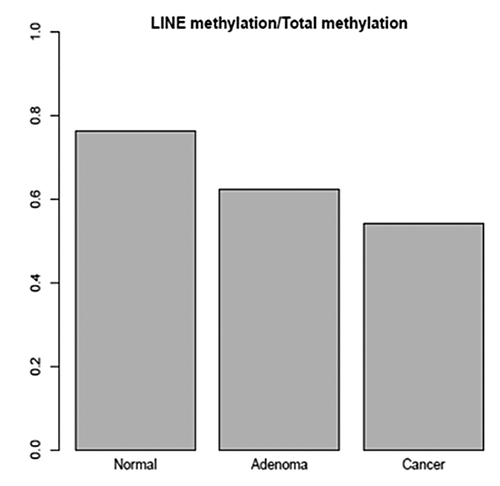
Figure 2. (A) Average methylation of promoter regions in normal and colon adenoma based on RefSeq genes annotations. Promoters that were hypermethylated only in normal colon are shown in red, while those hypermethylated only in colon adenoma are in blue, and promoters hypermethylated in both are shaded in orange. (B) Promoters from A filtered to include genes associated with various Gene Ontology (GO) terms. The Y-axis shows the average methylation in normal and the X-axis shows the average methylation in colonic adenomas.
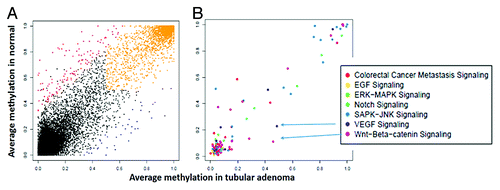
Figure 3. (A) Average methylation of promoters in tumor and normal based on RefSeq genes annotations. Promoters that were hypermethylated only in tumor are shown in red, those hypermethylated only in normal in blue and promoters hypermethylated in both are shaded orange. (B) Promoters from 3A filtered to include genes associated with various Gene Ontology (GO) terms. The Y-axis shows the average methylation in tumor and the X-axis shows the average in normal colon.
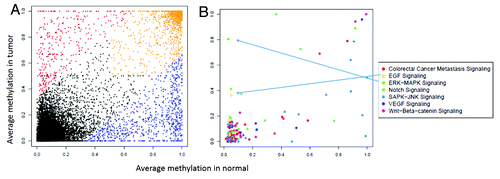
Figure 4. RRBS CpG methylation validation via targeted bisulfite sequencing for GPR75 in colon cancer. (A) Validation of 27 CpG sites in cancer tissues compared with corresponding matched normal tissues (n = 22). CpG sites from the tumor group are plotted in red and CpG sites from the normal tissue group are shown in green. The Y-axis shows the average methylation and the X-axis shows the type of samples. This region of GPR75 promoter as a whole was significantly (P < 0.0001) hypermethylated in the tumor group. (B) The CpG sites depicted as lollipop and the color indicates the level of methylation from higher to lower in yellow > orange > red order.
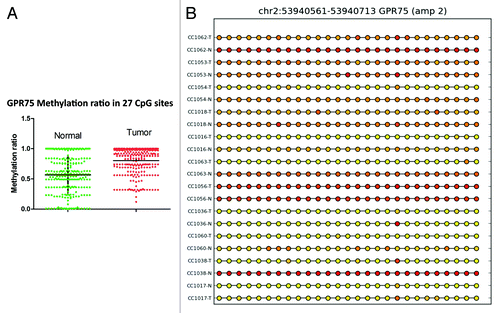
Figure 5. RRBS CpG methylation validation via targeted bisulfite sequencing for EID3 in colon cancer. (A) Validation of 17 CpG sites in cancer tissues compared with their corresponding matched normal tissues (n = 34). CpG sites from the tumor group are plotted in red and CpG sites from the normal tissue group are shown in green. The Y axis shows the average methylation and the X-axis shows the type of samples. This region of EID3 promoter as a whole was significantly (P < 0.0001) hypermethylated in the tumor group. (B) The CpG sites depicted as lollipop and the color indicate the level of methylation from higher to lower in yellow > orange > red order.
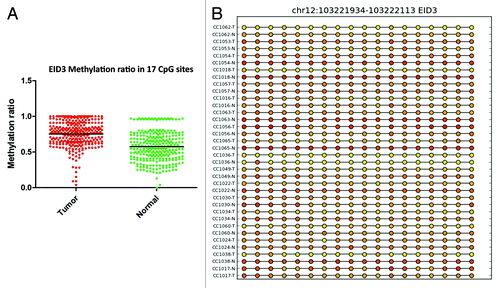
Figure 6. RRBS CpG methylation validation via targeted bisulfite sequencing for BMP3 in colon cancer. (A) Validation of 27 CpG sites in cancer tissues compared with their corresponding matched normal tissues (n = 24). CpG sites from the tumor group are plotted in red and CpG sites from the normal tissues group are shown in green. The Y-axis shows the average methylation and the X-axis shows the type of samples. This region of BMP3 promoter as a whole was significantly (P < 0.0001) hypermethylated in the tumor group. (B) The CpG sites depicted as lollipop and the color indicates the level of methylation from higher to lower in yellow > orange > red order.
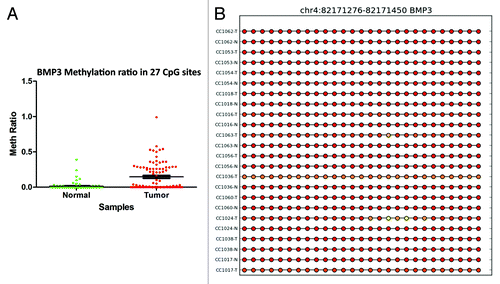
Figure 7. RRBS CpG methylation validation via targeted bisulfite sequencing for GAS7 in colon cancer. (A) Validation of 17 CpG sites in cancer tissues compared with their corresponding matched normal tissues (n = 18). CpG sites from the tumor group are plotted in red and CpG sites from the normal tissues group are shown in green. The Y-axis shows the average methylation and the X-axis shows the type of samples. This region of the GAS7 promoter as a whole was significantly (P < 0.0001) hypermethylated in the tumor group. (B) The CpG sites depicted as lollipop and the color indicates the level of methylation from higher to lower in yellow > orange > red order. CpG sites with no available data are represented by straight lines for two samples (CC1063N and CC1017N).
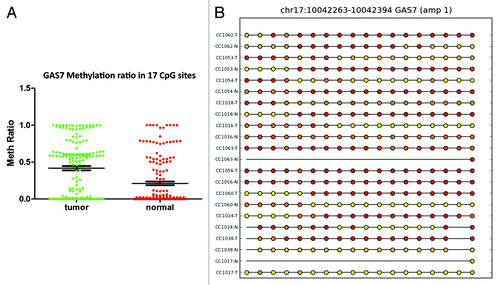
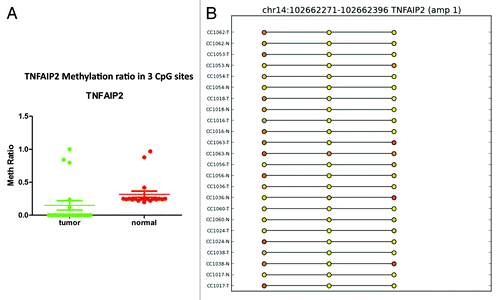
Figure 8. RRBS CpG methylation validation via targeted bisulfite sequencing for TNFAIP2 in colon cancer. (A) Validation of 3 CpG site in cancer tissues compared with their corresponding matched normal tissues (n = 24). CpG sites from the tumor group are plotted in red and CpG sites from the normal tissue group are shown in green. The Y-axis shows the average methylation and the X-axis shows the type of samples. This region of TNFAIP2 promoter as a whole was significantly (P < 0.0002) hypermethylated in the tumor group. (B) The CpG sites depicted as lollipop and the color indicates the level of methylation from higher to lower in yellow > orange > red order.