1,353
Views
21
CrossRef citations to date
0
Altmetric
Research Paper

A novel approach to the discovery of survival biomarkers in glioblastoma using a joint analysis of DNA methylation and gene expression

, , , , , & show all
Pages 873-883 | Received 15 Nov 2013, Accepted 17 Mar 2014, Published online: 26 Mar 2014

Figures & data

Table 1. Patient demographic and tumor* characteristics

Table 2. Final 35 DNA methylation/gene expression pairs that are significantly associated with survival

Figure 1. Significant expression-based and alternative associations of DNA methylation on gene expression and survival. The 35 unique DNA methylation/gene expression pairs were subjected to an Accelerated Failure Time (AFT) survival model and applied to alternative and expression-based equations (2–5 in methods). This yielded a total of 27 significant methylation/expression pairs, 10 had significant expression-based associations (A), 13 had significant alternative associations (B), and 4 had both significant expression-based and alternative associations (C). Grey lines indicate alternative associations, black lines indicate expression-based associations, gray circles indicate that the methylation locus for that gene pair was found in a CpG island, and black circles indicate that the methylation locus for that gene pair was not found in a CpG island. The y-axis indicates the change in survival time per 5% increase in methylation; therefore, effects that fall above the line are associated with an increase in survival, and effects that fall below the line are associated with a decrease in survival.
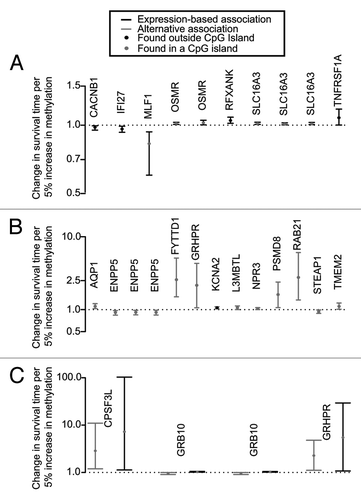
Figure 1. Significant expression-based and alternative associations of DNA methylation on gene expression and survival. The 35 unique DNA methylation/gene expression pairs were subjected to an Accelerated Failure Time (AFT) survival model and applied to alternative and expression-based equations (2–5 in methods). This yielded a total of 27 significant methylation/expression pairs, 10 had significant expression-based associations (A), 13 had significant alternative associations (B), and 4 had both significant expression-based and alternative associations (C). Grey lines indicate alternative associations, black lines indicate expression-based associations, gray circles indicate that the methylation locus for that gene pair was found in a CpG island, and black circles indicate that the methylation locus for that gene pair was not found in a CpG island. The y-axis indicates the change in survival time per 5% increase in methylation; therefore, effects that fall above the line are associated with an increase in survival, and effects that fall below the line are associated with a decrease in survival.

Figure 2. Model for mediation analysis. First a linear model adjusted for study was used to determine significantly correlated methylation/expression pairs. Next, a Cox proportional hazards model was used to find significant association between survival and expression, methylation, and their interaction term (adjusting for age, gender, and study phase). An Accelerated failure time model (AFT) was used to estimate the association between survival and expression, methylation, and their interaction term (adjusting for age, gender, and study phase), and a mediation analysis was performed to estimate the alternative and expression-based associations on glioma survival.
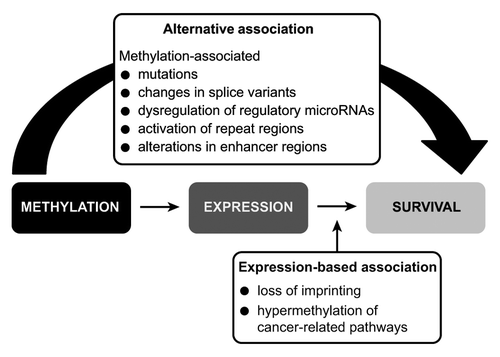
Figure 2. Model for mediation analysis. First a linear model adjusted for study was used to determine significantly correlated methylation/expression pairs. Next, a Cox proportional hazards model was used to find significant association between survival and expression, methylation, and their interaction term (adjusting for age, gender, and study phase). An Accelerated failure time model (AFT) was used to estimate the association between survival and expression, methylation, and their interaction term (adjusting for age, gender, and study phase), and a mediation analysis was performed to estimate the alternative and expression-based associations on glioma survival.

Table 3. Functions of significant genes and potential mechanisms in glioma

Supplemental material

Additional material

Download Zip (744 KB)

Reprints and Corporate Permissions

Please note: Selecting permissions does not provide access to the full text of the article, please see our help page How do I view content?

To request a reprint or corporate permissions for this article, please click on the relevant link below:

Academic Permissions

Please note: Selecting permissions does not provide access to the full text of the article, please see our help page How do I view content?

Obtain permissions instantly via Rightslink by clicking on the button below:

If you are unable to obtain permissions via Rightslink, please complete and submit this Permissions form. For more information, please visit our Permissions help page.