1,112
Views
15
CrossRef citations to date
0
Altmetric
Research Paper

ABCB1 regulation through LRPPRC is influenced by the methylation status of the GC -100 box in its promoter

, , , , , , , & show all
Pages 1172-1183 | Received 10 Feb 2014, Accepted 20 Jun 2014, Published online: 02 Jul 2014

Figures & data

Figure 1. ChIP assay for the in vivo quantification of LRPPRC binding to the ABCB1 promoter. RT-qPCR quantification of LRPPRC binding to the ABCB1promoter in K562 and Lucena cells after ChIP assay. DNA amplification was quantified in bound and unbound fractions after normalization with SMAD8 nonspecific amplification. Normalized fractions were used to calculate the bound/input ratio. Results are expressed as mean ± SD for three independent experiments.
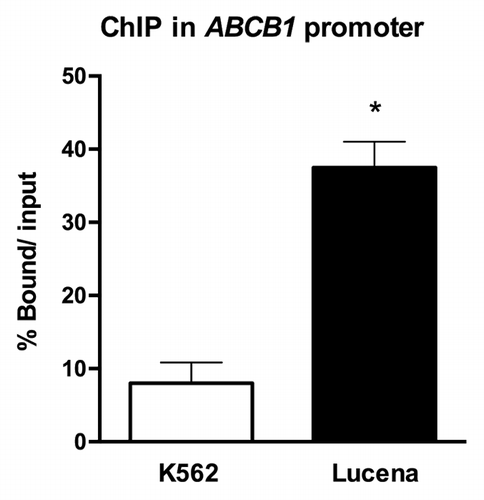
Figure 1. ChIP assay for the in vivo quantification of LRPPRC binding to the ABCB1 promoter. RT-qPCR quantification of LRPPRC binding to the ABCB1promoter in K562 and Lucena cells after ChIP assay. DNA amplification was quantified in bound and unbound fractions after normalization with SMAD8 nonspecific amplification. Normalized fractions were used to calculate the bound/input ratio. Results are expressed as mean ± SD for three independent experiments.

Figure 2. Expression of ABCB1/Pgp levels after LRPPRC depletion in CML cell lines. (A)Analysis of LRPPRC mRNA levels after transient LRPPRC knockdown in K562 and Lucena cells. (B)Analysis of ABCB1 mRNA levels after siLRPPRC. Total RNA was isolated and used in RT-qPCR analysis to determine changes in LRPPRC and ABCB1 mRNA levels after normalization to β-actin expression. All data are presented as fold inductions relative to control group expression (scrambled). (C)Representative western blot analysis of LRPPRC and Pgp expression. Protein extract (50 μg) from both cell lines were separated on a 12% SDS-PAGE gel and probed with anti- LRPPRC and anti-MDR1 antibodies. α-tubulin was used as a loading control. (D) Representative histograms of Pgp expression after 50 nM siLRPPRC (1): K562 ctrl and siLRPPRC (2): Lucena ctrl and siLRPPRC cells. PE-isotype antibody was used as a control. The results are expressed as the mean ± SD for three independent experiments. Ctrl: control; Sc: scrambled; Si: siRNA; K5: K562; LU: Lucena.
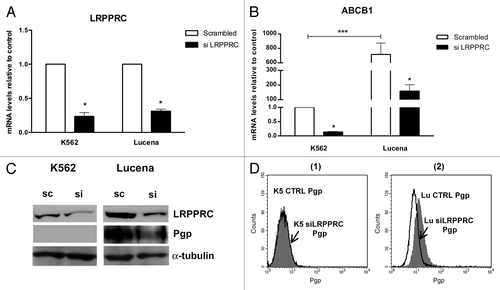
Figure 2. Expression of ABCB1/Pgp levels after LRPPRC depletion in CML cell lines. (A)Analysis of LRPPRC mRNA levels after transient LRPPRC knockdown in K562 and Lucena cells. (B)Analysis of ABCB1 mRNA levels after siLRPPRC. Total RNA was isolated and used in RT-qPCR analysis to determine changes in LRPPRC and ABCB1 mRNA levels after normalization to β-actin expression. All data are presented as fold inductions relative to control group expression (scrambled). (C)Representative western blot analysis of LRPPRC and Pgp expression. Protein extract (50 μg) from both cell lines were separated on a 12% SDS-PAGE gel and probed with anti- LRPPRC and anti-MDR1 antibodies. α-tubulin was used as a loading control. (D) Representative histograms of Pgp expression after 50 nM siLRPPRC (1): K562 ctrl and siLRPPRC (2): Lucena ctrl and siLRPPRC cells. PE-isotype antibody was used as a control. The results are expressed as the mean ± SD for three independent experiments. Ctrl: control; Sc: scrambled; Si: siRNA; K5: K562; LU: Lucena.

Figure 3. Regulation of ABCB1 promoter transcription activity via theinvMED1 binding site.(A) Scheme of invMED1 constructs. (B) Luciferase activity reporter assay in K562 and Lucena cells. All luciferase assay results are expressed as relative light units (RLU). The results are expressed as the mean ± SD for three independent experiments.
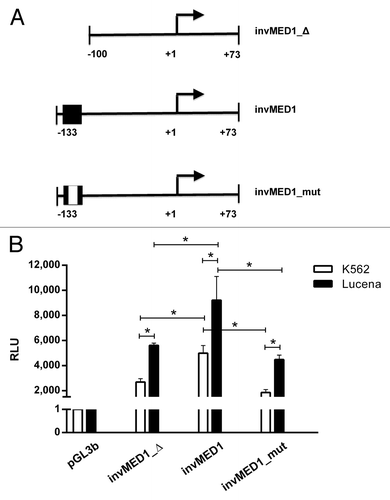
Figure 3. Regulation of ABCB1 promoter transcription activity via theinvMED1 binding site.(A) Scheme of invMED1 constructs. (B) Luciferase activity reporter assay in K562 and Lucena cells. All luciferase assay results are expressed as relative light units (RLU). The results are expressed as the mean ± SD for three independent experiments.

Figure 4. 5-Aza-dC treatment alters cell viability. Viable K562 and Lucena cells were assessed by Trypan blue staining after 24 h culture in the absence (ctrl) or presence of 0.5μM and 1 μM 5-Aza-dC. Results are expressed as mean ± SD for three independent experiments. Ctrl: control.
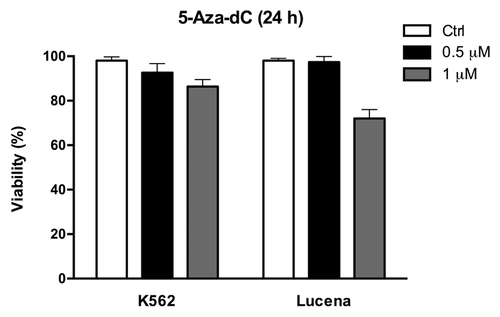
Figure 4. 5-Aza-dC treatment alters cell viability. Viable K562 and Lucena cells were assessed by Trypan blue staining after 24 h culture in the absence (ctrl) or presence of 0.5μM and 1 μM 5-Aza-dC. Results are expressed as mean ± SD for three independent experiments. Ctrl: control.

Figure 5. Effect of 5-Aza-dC treatment on ABCB1/Pgp levels and LRPPRC binding to the invMED1 site. (A)ABCB1 mRNA levels were evaluated after 24 h of 0.5 μM 5-Aza-dC treatment. Total RNA was isolated and used in RT-qPCR to determine changes in ABCB1 mRNA levels after normalization to β-actin expression. (B) Representative histograms of Pgp expression after 0.5 μM 5-Aza-dC treatment (1): K562 ctrl and 5-Aza-dC-treated K562 cells (2): Lucena ctrl and Lucena cells treated with 5-Aza-dC. PE-isotype antibody was used as a control. (C) RT-qPCR quantification of LRPPRC binding to the ABCB1 promoter in 5-Aza-dC-treated K562 and Lucena cells. DNA amplification was quantified in bound and unbound fractions after normalization with SMAD8 nonspecific amplification. Normalized fractions were used to calculate the bound/input ratio. The results are expressed as the mean ± SD for three independent experiments. Ctrl: control; K5: K562; LU: Lucena.
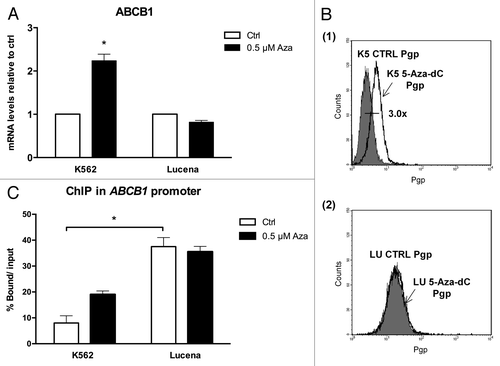
Figure 5. Effect of 5-Aza-dC treatment on ABCB1/Pgp levels and LRPPRC binding to the invMED1 site. (A)ABCB1 mRNA levels were evaluated after 24 h of 0.5 μM 5-Aza-dC treatment. Total RNA was isolated and used in RT-qPCR to determine changes in ABCB1 mRNA levels after normalization to β-actin expression. (B) Representative histograms of Pgp expression after 0.5 μM 5-Aza-dC treatment (1): K562 ctrl and 5-Aza-dC-treated K562 cells (2): Lucena ctrl and Lucena cells treated with 5-Aza-dC. PE-isotype antibody was used as a control. (C) RT-qPCR quantification of LRPPRC binding to the ABCB1 promoter in 5-Aza-dC-treated K562 and Lucena cells. DNA amplification was quantified in bound and unbound fractions after normalization with SMAD8 nonspecific amplification. Normalized fractions were used to calculate the bound/input ratio. The results are expressed as the mean ± SD for three independent experiments. Ctrl: control; K5: K562; LU: Lucena.

Figure 6. 5-Aza-dC treatment alters response to IM treatment in K562 cells. (A) Apoptosis level was assessed in K562 cells under the following conditions: 1 μM IM, 5μM 5-Aza-dC (3 wk treatment), co-treatment, and at the absence (ctrl) of both drugs. (B) Representative histograms of Pgp expression after 5 μM 5-Aza-dC treatment after 3 wk: K562 ctrl, 5-Aza-dC –treated K562 cells and Lucena cells (used for positive control of Pgp expression). PE-isotype antibody was used as a control. The results are expressed as the mean ± SD for three independent experiments. Ctrl: control.
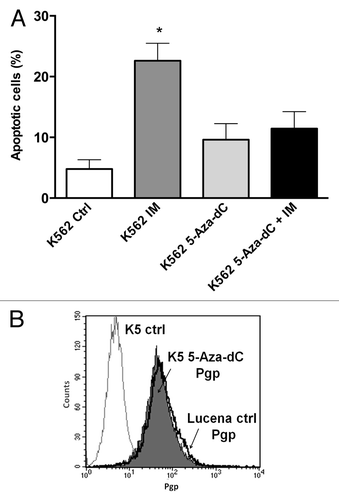
Figure 6. 5-Aza-dC treatment alters response to IM treatment in K562 cells. (A) Apoptosis level was assessed in K562 cells under the following conditions: 1 μM IM, 5μM 5-Aza-dC (3 wk treatment), co-treatment, and at the absence (ctrl) of both drugs. (B) Representative histograms of Pgp expression after 5 μM 5-Aza-dC treatment after 3 wk: K562 ctrl, 5-Aza-dC –treated K562 cells and Lucena cells (used for positive control of Pgp expression). PE-isotype antibody was used as a control. The results are expressed as the mean ± SD for three independent experiments. Ctrl: control.

Figure 7. Pyrosequencing analysis of the GC -100 box in CML cell lines. Representative pyrosequencing analysis of (A) K562 and (B) Lucena cells for the methylation level (%) at GC -100 box. (C) Results are expressed as the mean ± SD for three independent experiments. * Position of potential 5mC (Y).
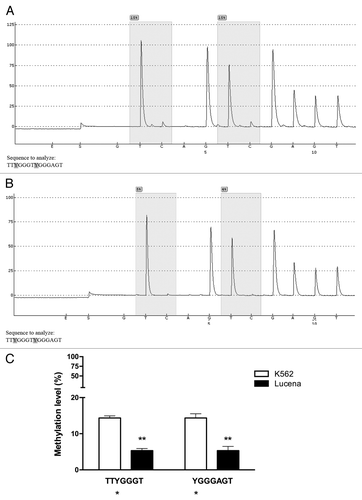
Figure 7. Pyrosequencing analysis of the GC -100 box in CML cell lines. Representative pyrosequencing analysis of (A) K562 and (B) Lucena cells for the methylation level (%) at GC -100 box. (C) Results are expressed as the mean ± SD for three independent experiments. * Position of potential 5mC (Y).
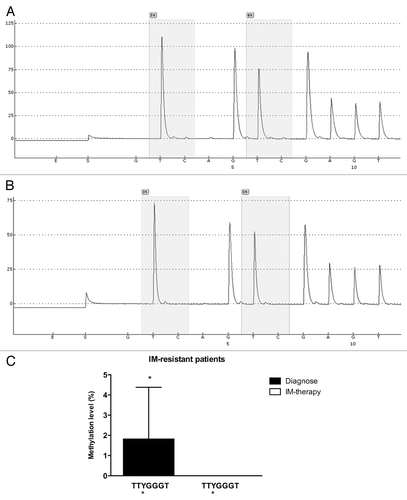
Figure 8. Pyrosequencing analysis of the GC -100 box in CML patients. Representative pyrosequencing analysis for the methylation level (%) at GC -100 box. (A) IM-resistant patient at diagnoses and (B) the same IM-resistant patient at relapse (C) Results are expressed as the mean ± SD for three independent experiments. * Position of potential 5mC (Y).

Figure 8. Pyrosequencing analysis of the GC -100 box in CML patients. Representative pyrosequencing analysis for the methylation level (%) at GC -100 box. (A) IM-resistant patient at diagnoses and (B) the same IM-resistant patient at relapse (C) Results are expressed as the mean ± SD for three independent experiments. * Position of potential 5mC (Y).

Reprints and Corporate Permissions

Please note: Selecting permissions does not provide access to the full text of the article, please see our help page How do I view content?

To request a reprint or corporate permissions for this article, please click on the relevant link below:

Academic Permissions

Please note: Selecting permissions does not provide access to the full text of the article, please see our help page How do I view content?

Obtain permissions instantly via Rightslink by clicking on the button below:

If you are unable to obtain permissions via Rightslink, please complete and submit this Permissions form. For more information, please visit our Permissions help page.