Figures & data
Figure 1. Study design and analysis workflow. Three pairs of affected (with DNMT1 mutation and HSAN1) and unaffected siblings (without DNMT1 mutation and HSAN1) were selected from three different families of the same kinship. The sibling pairs were matched for age (<5 y) and gender. WGBS was performed on peripheral lymphocyte cells and DMCs and DMRs were identified by paired analyses. Genes with DMRs 5 kb from theTSS were used for pathway enrichment analysis. A1-A3, affected individuals with DNMT1 mutation; U1-U3, unaffected siblings without DNMT1 mutation.
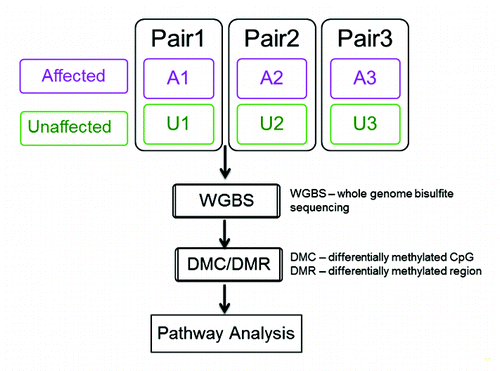
Figure 2. Genome coverage and overall methylation patterns. (A) Captured Cs in CpG context at different depths of coverage. Almost all CpGs in the genome were covered; however, CpGs with at least 10X coverage accounted for about 1/3 of ~30million CpGs in the genome. (B) Overall mean methylation was reduced by 0.3–3% in affected individuals (A1–3) relative to unaffected controls (U1–3;). (C) Methylation distribution of genic CpGs by sample. The affected had slightly lower methylation than their unaffected siblings. The horizontal bar within each box is the median methylation for the sample. (D) Methylation distribution of intergenic CpGs by sample. The affected patients had lower methylation than unaffected individuals and the differences were greater than in genic regions. The horizontal bar within each box is the median methylation for the sample. (E) CGI and repeat region methylation. CGI methylation was low (~30%) across all samples with little difference between samples while methylation in repeat regions (Alu, L1, L2, satellite, and simple repeats) was higher (≥70%). The affected patients consistently had lower methylation (1–5% reduction) than their unaffected siblings. (F) Methylation difference between sibling pairs in CGIs and repeat elements. All repeat elements but not CGIs had lower methylation in the affected individuals with Pair 1 (P1) displaying the smallest differences.
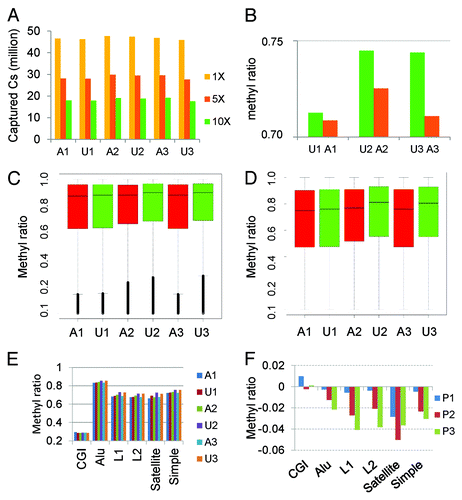
Figure 3. (A) Unsupervised clustering using the top 126 000 varied CpGs shows the affected and unaffected samples form different clusters, suggesting the similar methylation patterns by mutation status. (B) Unsupervised clustering using top 10 000 highly varied CpGs shows samples are clustered by family, indicating the strong genetic influence on DNA methylation.
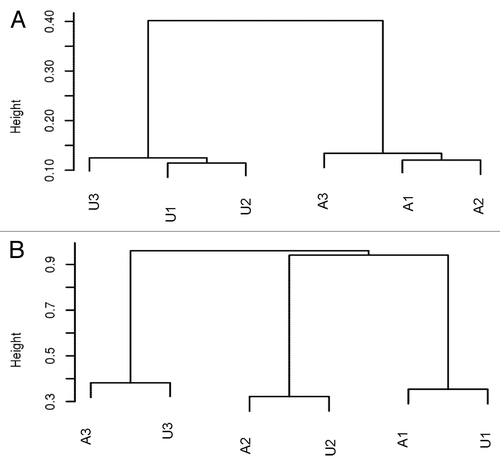
Figure 4. Methylation by chromosome. (A) DMCs are plotted for each chromosome separately. All show the dominant hypo-DMCs with chromosome X changed the most. Y-axis: The distribution of methylation mean difference between affected and unaffected individuals. (B) Chromosome X CpG methylation distribution. Affected patients (red) have more obvious reduced methylation than the unaffected (green) for all pairs. (C) Density plot of CpG methylation for chromosome X for each sample. Affected patients have left-shifted (decreased) methylation ratio curves. Solid line: patients with mutation; Dashed lines: sibling controls without mutation. Red lines: A1, A2; Green lines: A2, U2; Blue lines: A3, U3.
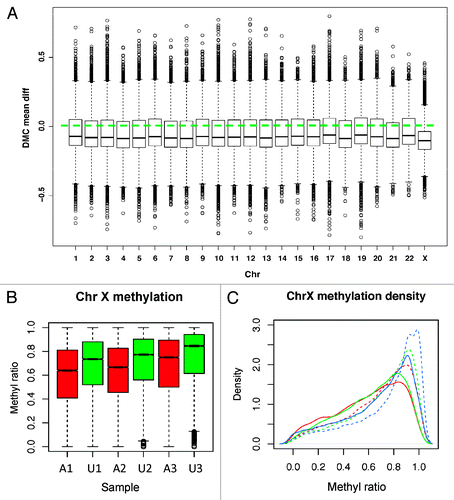
Figure 5. DMC distribution in different genomic regions. (A) DMCs occur across genomic regions; however, intergenic regions have higher percentage of hypomethylated CpGs than genic regions. (B) Hypomethylation around transcription start site (TSS). All genes are aligned around TSS and average methylation is displayed separately for affected (red) and unaffected (green) subjects. (C) DMCs in different genomic features of genic regions. All regions except CpG islands have more hypo-methylated DMCs in the affected individuals. (D) DMCs in different genomic features of intergenic regions. All have more hypo-methylated DMCs in the affected individuals. X-axis, genomic region; y-axis, percentage of hypermethylated (purple bars) and hypomethylated DMCs (green bars).
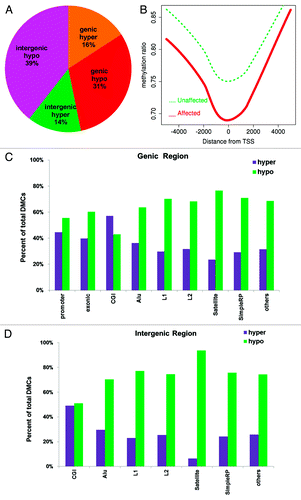
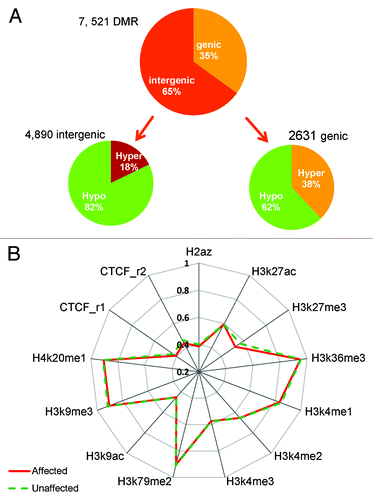
Figure 6. DMR distribution in the genome and DNA methylation in histone marks. (A) Most DMRs are hypomethylated for both genic and intergenic regions; however, this is much more dramatic in intergenic regions (82% vs. 62%). (B) Median methylation difference in different histone mark region between the affected and unaffected individuals. Hypomethylation is observed in H3K27me3, H3K9me3, and CTCF sites.