1,177
Views
68
CrossRef citations to date
0
Altmetric
Research Paper

Tissue specific DNA methylation of CpG islands in normal human adult somatic tissues distinguishes neural from non-neural tissues

, , , , &
Pages 527-538 | Received 29 Mar 2010, Accepted 04 May 2010, Published online: 16 Aug 2010

Figures & data

Figure 1 An example of tissue specific methylation identified by RLGS analysis of 12 tissues and quantitated by Southern blot analysis. (A) Cutouts of the full RLGS analysis on all 12 tissues with arrows indicating fragment 3D24. (B) Quantitative Southern blot analysis using the 3D24 NotI-EcoRV fragment as hybridization probe. Lane one contains cerebellar cortex DNA digested with EcoRV only. Lanes 2–13 are all double digested with EcoRV and NotI. The DNAs in lanes 2–13 are loaded in the same order as indicated in (A) with peripheral nerve replacing kidney in lane 8. Depending on DNA availability, 0.5 µg (peripheral nerve) to 10 µg (cerebellar cortex) were loaded in each lane. Bands indicating methylation or no methylation are indicated. (C) Quantitation of the percent methylation detected by the Southern blot in (B). For lanes 2–13, percent methylation was determined as described in the Materials and Methods. *, 13 kb EcoRV sequence without a NotI site that is homologous to the probe. BLAST analysis with the probe sequence identified a BAC clone explaining this band.Citation29 (D) Representative RLGS profilesections showing spot 3B07 and demonstrating consistent spot presence (lack of methylation) in C. cort of multiple patients, but spot absence (methylation) in other brain regions from multiple patients. Abbreviations: B. gang, basal ganglia; C. cort, Cerebellar cortex; C. white, Cerebellar white matter; F. cort, Frontal lobe cortex; F. white, Frontal lobe white matter; T. cort, Temporal lobe cortex.
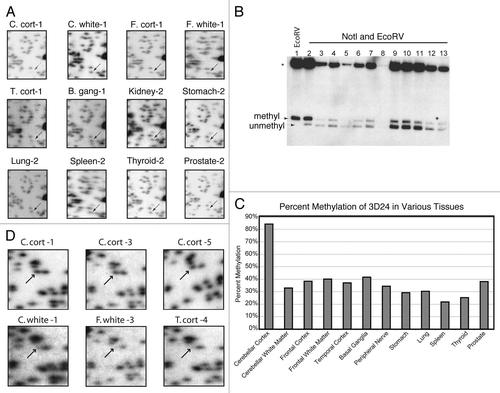
Figure 1 An example of tissue specific methylation identified by RLGS analysis of 12 tissues and quantitated by Southern blot analysis. (A) Cutouts of the full RLGS analysis on all 12 tissues with arrows indicating fragment 3D24. (B) Quantitative Southern blot analysis using the 3D24 NotI-EcoRV fragment as hybridization probe. Lane one contains cerebellar cortex DNA digested with EcoRV only. Lanes 2–13 are all double digested with EcoRV and NotI. The DNAs in lanes 2–13 are loaded in the same order as indicated in (A) with peripheral nerve replacing kidney in lane 8. Depending on DNA availability, 0.5 µg (peripheral nerve) to 10 µg (cerebellar cortex) were loaded in each lane. Bands indicating methylation or no methylation are indicated. (C) Quantitation of the percent methylation detected by the Southern blot in (B). For lanes 2–13, percent methylation was determined as described in the Materials and Methods. *, 13 kb EcoRV sequence without a NotI site that is homologous to the probe. BLAST analysis with the probe sequence identified a BAC clone explaining this band.Citation29 (D) Representative RLGS profilesections showing spot 3B07 and demonstrating consistent spot presence (lack of methylation) in C. cort of multiple patients, but spot absence (methylation) in other brain regions from multiple patients. Abbreviations: B. gang, basal ganglia; C. cort, Cerebellar cortex; C. white, Cerebellar white matter; F. cort, Frontal lobe cortex; F. white, Frontal lobe white matter; T. cort, Temporal lobe cortex.

Figure 2 Hierarchical clustering of RLGS data. The heat map and dendogram (top) show the “manhattan” distance (absolute distance) between samples using the “Ward” method for clustering. The RLGS spots are arranged on the Y-axis. Black boxes indicate RLGS spots that were positive for methylation in the indicated tissue. Tissues are arranged on the X-axis. Abbreviations: B. gang, basal ganglia; C. cort, Cerebellar cortex; C. white, Cerebellar white matter; F. cort, Frontal lobe cortex; F. white, Frontal lobe white matter; T. cort, Temporal lobe cortex; Ecto, ectoderm derived tissue; Meso, mesoderm derived tissue; Endo, endoderm derived tissue.
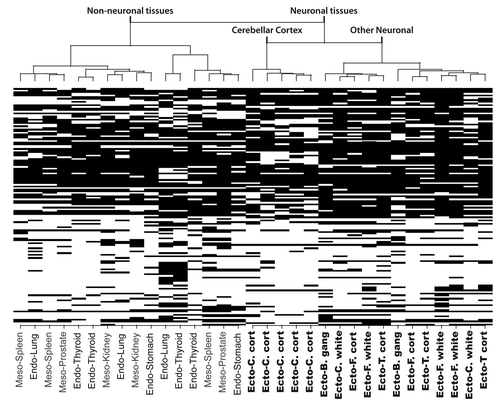
Figure 2 Hierarchical clustering of RLGS data. The heat map and dendogram (top) show the “manhattan” distance (absolute distance) between samples using the “Ward” method for clustering. The RLGS spots are arranged on the Y-axis. Black boxes indicate RLGS spots that were positive for methylation in the indicated tissue. Tissues are arranged on the X-axis. Abbreviations: B. gang, basal ganglia; C. cort, Cerebellar cortex; C. white, Cerebellar white matter; F. cort, Frontal lobe cortex; F. white, Frontal lobe white matter; T. cort, Temporal lobe cortex; Ecto, ectoderm derived tissue; Meso, mesoderm derived tissue; Endo, endoderm derived tissue.

Figure 3 RLGS profiles of spot 3D46 showing neural vs. non-neural tissue specificity. (A) The spot is absent (top) or faintly present (bottom) in ectodermal tissues (C. cortex, T. cortex and B. ganglia). (B) In mesodermal and endodermal tissues (stomach, spleen, lung and thyroid) the spot is clearly present, hence unmethylated. Abbreviations: B. gang, basal ganglia; C. cort, cerebellar cortex; C. white, cerebellar white matter; F. white, frontal lobe white matter; T. cort, temporal lobe cortex.
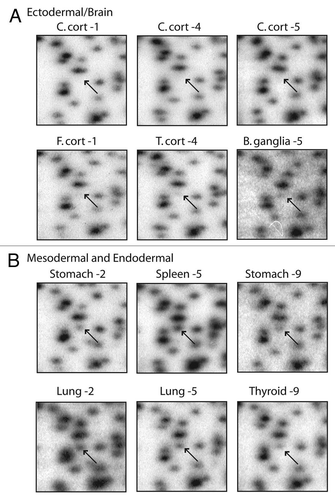
Figure 3 RLGS profiles of spot 3D46 showing neural vs. non-neural tissue specificity. (A) The spot is absent (top) or faintly present (bottom) in ectodermal tissues (C. cortex, T. cortex and B. ganglia). (B) In mesodermal and endodermal tissues (stomach, spleen, lung and thyroid) the spot is clearly present, hence unmethylated. Abbreviations: B. gang, basal ganglia; C. cort, cerebellar cortex; C. white, cerebellar white matter; F. white, frontal lobe white matter; T. cort, temporal lobe cortex.

Figure 4A and B Confirmation of RLGS data using MAQMA. (A) MAQMA data for the 1F22 CpG island on all normal human tissues. Each line represents a single sample as labeled on the left indicating the patient number and tissue. In the beads-on-a string diagram, each bead represents a CpG dinucleotide. The percent of methylation is indicated by the grey scale shading as shown by the key at the top of the figure with dark grey representing 100% methylation. The two lung samples at the bottom failed to PCR amplify. To test for bisulfite PCR bias we used peripheral blood lymphocyte (PBL) DNA as a 0% methylation control, and an in vitro methylated (IVM) aliquot of the same DNA as a 100% methylated control. These DNAs were mixed at appropriate ratios to generate 75, 50 and 25% methylated controls and all the controls were bisulfite treated and used as template for bisulfite PCR and MAQMA analysis and shown at the top of the figure. (B–E) The average level of methylation detected by MAQMA across the sequenced fragment of the CpG islands for each samples is shown on the y-axis. This value comes from taking the average of MAQMA values for each CpG dinucleotide sequenced for each sample for each of the four RLGS spots indicated at the top of each figure. The samples are divided up categorically along the x-axis by tissue type on the left, and by neural vs. non-neural tissue on the right. Each symbol represents a single sample. The black, filled in circles indicate the cerebellar cortex samples. p values were determined using the Wilcoxon rank sum testCitation39 to determine if there were differences in mean methylation levels between neural and non-neural. Values are given for the Wilcoxon rank sum test performed both with and without the cerebellar cortex samples.
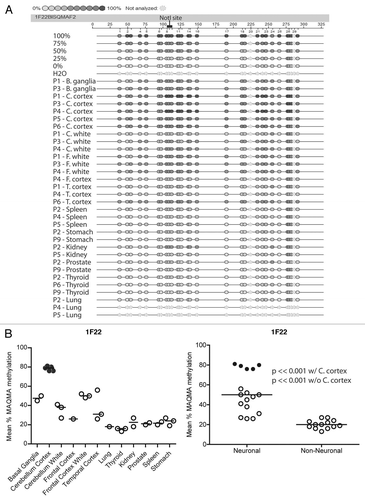
Figure 4A and B Confirmation of RLGS data using MAQMA. (A) MAQMA data for the 1F22 CpG island on all normal human tissues. Each line represents a single sample as labeled on the left indicating the patient number and tissue. In the beads-on-a string diagram, each bead represents a CpG dinucleotide. The percent of methylation is indicated by the grey scale shading as shown by the key at the top of the figure with dark grey representing 100% methylation. The two lung samples at the bottom failed to PCR amplify. To test for bisulfite PCR bias we used peripheral blood lymphocyte (PBL) DNA as a 0% methylation control, and an in vitro methylated (IVM) aliquot of the same DNA as a 100% methylated control. These DNAs were mixed at appropriate ratios to generate 75, 50 and 25% methylated controls and all the controls were bisulfite treated and used as template for bisulfite PCR and MAQMA analysis and shown at the top of the figure. (B–E) The average level of methylation detected by MAQMA across the sequenced fragment of the CpG islands for each samples is shown on the y-axis. This value comes from taking the average of MAQMA values for each CpG dinucleotide sequenced for each sample for each of the four RLGS spots indicated at the top of each figure. The samples are divided up categorically along the x-axis by tissue type on the left, and by neural vs. non-neural tissue on the right. Each symbol represents a single sample. The black, filled in circles indicate the cerebellar cortex samples. p values were determined using the Wilcoxon rank sum testCitation39 to determine if there were differences in mean methylation levels between neural and non-neural. Values are given for the Wilcoxon rank sum test performed both with and without the cerebellar cortex samples.
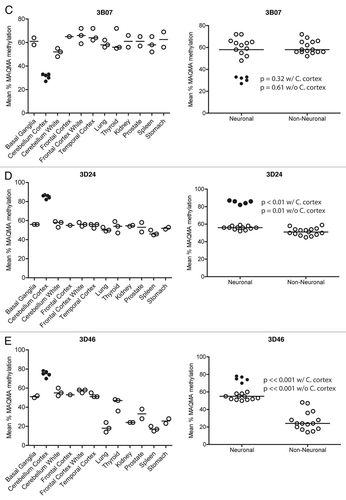
Figure 4C–E Confirmation of RLGS data using MAQMA. (B–E) The average level of methylation detected by MAQMA across the sequenced fragment of the CpG islands for each samples is shown on the y-axis. This value comes from taking the average of MAQMA values for each CpG dinucleotide sequenced for each sample for each of the four RLGS spots indicated at the top of each figure. The samples are divided up categorically along the x-axis by tissue type on the left, and by neural vs. non-neural tissue on the right. Each symbol represents a single sample. The black, filled in circles indicate the cerebellar cortex samples. p values were determined using the Wilcoxon rank sum testCitation39 to determine if there were differences in mean methylation levels between neural and non-neural. Values are given for the Wilcoxon rank sum test performed both with and without the cerebellar cortex samples.

Figure 4C–E Confirmation of RLGS data using MAQMA. (B–E) The average level of methylation detected by MAQMA across the sequenced fragment of the CpG islands for each samples is shown on the y-axis. This value comes from taking the average of MAQMA values for each CpG dinucleotide sequenced for each sample for each of the four RLGS spots indicated at the top of each figure. The samples are divided up categorically along the x-axis by tissue type on the left, and by neural vs. non-neural tissue on the right. Each symbol represents a single sample. The black, filled in circles indicate the cerebellar cortex samples. p values were determined using the Wilcoxon rank sum testCitation39 to determine if there were differences in mean methylation levels between neural and non-neural. Values are given for the Wilcoxon rank sum test performed both with and without the cerebellar cortex samples.

Table 1 Tissue specific methylation of cloned RLGS spots

Table 2 Genomic context of RLGS spots

Supplemental material

Additional material

Download Zip (280.5 KB)

Reprints and Corporate Permissions

Please note: Selecting permissions does not provide access to the full text of the article, please see our help page How do I view content?

To request a reprint or corporate permissions for this article, please click on the relevant link below:

Academic Permissions

Please note: Selecting permissions does not provide access to the full text of the article, please see our help page How do I view content?

Obtain permissions instantly via Rightslink by clicking on the button below:

If you are unable to obtain permissions via Rightslink, please complete and submit this Permissions form. For more information, please visit our Permissions help page.