Figures & data
Figure 1 (A) Methylation rates by gene for each of the genes examined across the recognized cytogenetic risk groups. The good risk group includes 10 patients with t(8; 21), inv(16) or t(15:17) mutations, the intermediate group includes 106 patients with normal karyotype leukemia and 14 patients with <3 karyotypic abnormalities, the adverse group includes 30 patients with complex karyotype and 9 patients with abnormalities involving chromosomes 5, 7 or 11q23. No significant differences were observed between each of these cytogenetic risk groups. (B) When patients with normal karyotype were compared to those with a structural karyotype abnormality, differences in methylation frequency were observed. Methylation of CEBP-α, CTNNA1, ER and p73 (*) were significantly different between the two groups (p < 0.05).
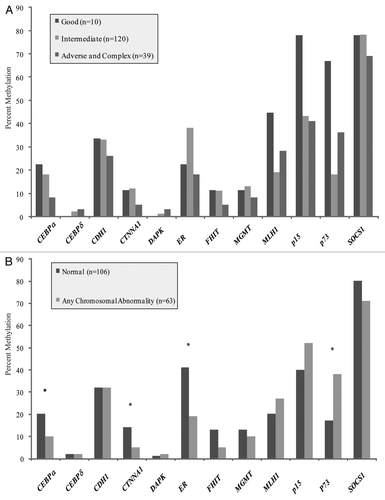
Figure 2 (A) No significant differences were observed between rates of methylation for normal karyotype samples with and without a FLT3-ITD mutation. (B) No significant differences in rates of methylation were observed between samples with and without a NPM1 mutation.
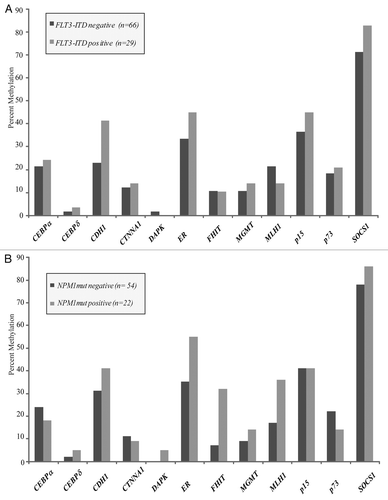
Figure 3 (A) No significant differences were seen between samples obtained from patients with de novo leukemia and those presenting with a history of an antecedent hematologic abnormality. Patients in the latter group were older, with a median age of 69 years vs. 52 years in the de novo group, and all had a diagnosis of AML at the time of sample acquisition. (B) There were no differences in methylation between normal karyotype samples obtained at the time of diagnosis as compared to those obtained at the time of AML relapse.
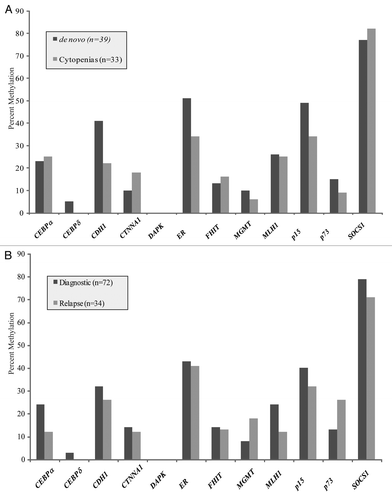
Figure 4 (A) Schematic of p73 gene demonstrating its 14 exons and the location of our MSP and RT-PCR primers. The TAp73 transcript includes exons 1–14 and has a dense CpG island upstream of the transcription start site. The DNp73 transcript includes exons 3–14. (B) Methylation Specific PCR reactions for leukemia cell lines KG1a, U937, HL60 and ML1. KG1a and U937 demonstrate complete methylation, HL60 is hemimethylated for p73, ML1 is unmethylated. NL is a negative control for methylation in normal peripheral blood lymphocytes and IVD is a positive control for methylation. (C) RT-PCR for the long (TAp73) and short (DAp73) transcripts of p73. TAp73 exerts a pro-apoptotic and DNp73 an anti-apoptotic effect. Methylation of the p73 promoter preferentially silences the long transcript of p73 while allowing continued expression of the short transcript, favoring an anti-apoptotic phenotype. (D) Treatment for 72 h with 1 µM 5-azacytidine (5AC) reverses methylation, while untreated (mock) and SAHA treated cell lines maintain a methylated phenotype. (E) Treatment of KG1a and U937 cell lines with 5AC results in re-expression of silenced TAp73 (both) and DNp73 (KG1a).
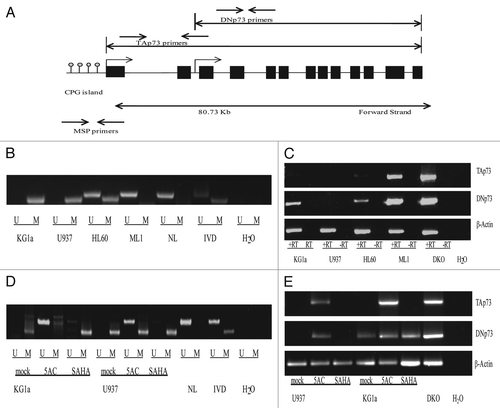
Figure 5 Uniformly treated patients with normal karyotype AML at initial diagnosis (n = 72) (A) Multivariate hazard ratio for relapse by gene with 95% confidence intervals designated by black bars. (B) Multivariate hazard ratio for death by gene corrected for age, antecedent cytopenia(s) at diagnosis, FLT3-ITD and NPM1 mutational status and total white blood cell count at time of AML diagnosis with 95% confidence intervals designated by black bars.
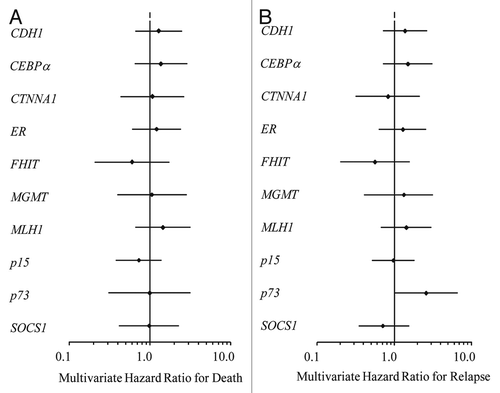
Table 1 Characteristics of the study population