600
Views
39
CrossRef citations to date
0
Altmetric
Research Paper

Reactivation of MASPIN in non-small cell lung carcinoma (NSCLC) cells by artificial transcription factors (ATFs)

Pages 224-235 | Received 22 Jul 2010, Accepted 20 Sep 2010, Published online: 01 Feb 2011

Figures & data

Figure 1 MASPIN expression in a panel of NSC LC cell lines. (A) MASPIN mRNA expression levels by quantitative real-time PCR in a panel of NSCLC cell lines. MASPIN mRNA levels were normalized to the immortalized bronchial epithelial cell line (BEAS-2B). Data represent the mean ± SD of three independent experiments. (B) MASPIN protein expression in high- and low-MASPIN expressing cell lines. (C) Loss of MASPIN expression correlates with invasion abilities in NSC LC cell lines. (D) Immunofluorescence staining of MASPIN in BEAS-2B and in the NSCLC cell lines. ↑ Indicates nuclear and ➭ indicates cytoplasmic staining, respectively.
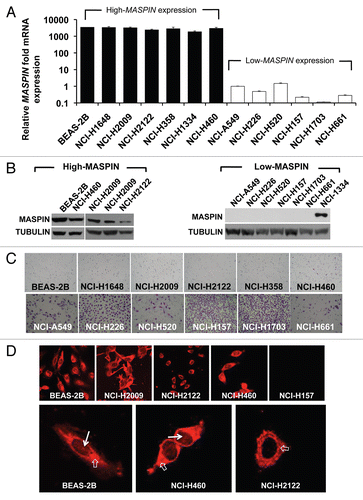
Figure 1 MASPIN expression in a panel of NSC LC cell lines. (A) MASPIN mRNA expression levels by quantitative real-time PCR in a panel of NSCLC cell lines. MASPIN mRNA levels were normalized to the immortalized bronchial epithelial cell line (BEAS-2B). Data represent the mean ± SD of three independent experiments. (B) MASPIN protein expression in high- and low-MASPIN expressing cell lines. (C) Loss of MASPIN expression correlates with invasion abilities in NSC LC cell lines. (D) Immunofluorescence staining of MASPIN in BEAS-2B and in the NSCLC cell lines. ↑ Indicates nuclear and ➭ indicates cytoplasmic staining, respectively.

Figure 2 ATFs regulate MASPIN in high- and low-MASPIN expressing NSC LC cell lines. (A) Relative MASPIN mRNA upregulation in the high-MASPIN expressing cell lines NCI-H358 and NCI-H460. (B) Relative MASPIN expression in the low-MASPIN expressing cell lines NCI-A549, NCI-H157, NCI-H226, NCI-H520, NCI-H1703 and NCI-H661. MASPIN mRNA expression levels were measured by quantitative real-time PC R and data was normalized to the untransduced cell lines. Experiments were run in triplicate and data represent the mean ± SD of three independent biological replicates (*p < 0.05, as determined by ANOVA). Cell line refers to untransduced NSC LC cell lines; control, cells transduced with an empty retroviral vector; ATF-97, ATF-126 and ATF-452, cells transduced with the corresponding ATFs; ATF-126NOVP is a control ATF-126 lacking the VP64 activator domain; PMXVP64-SS is a control vector expressing the VP64 activator domain only.
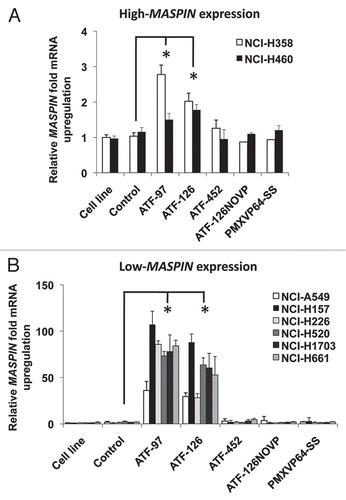
Figure 2 ATFs regulate MASPIN in high- and low-MASPIN expressing NSC LC cell lines. (A) Relative MASPIN mRNA upregulation in the high-MASPIN expressing cell lines NCI-H358 and NCI-H460. (B) Relative MASPIN expression in the low-MASPIN expressing cell lines NCI-A549, NCI-H157, NCI-H226, NCI-H520, NCI-H1703 and NCI-H661. MASPIN mRNA expression levels were measured by quantitative real-time PC R and data was normalized to the untransduced cell lines. Experiments were run in triplicate and data represent the mean ± SD of three independent biological replicates (*p < 0.05, as determined by ANOVA). Cell line refers to untransduced NSC LC cell lines; control, cells transduced with an empty retroviral vector; ATF-97, ATF-126 and ATF-452, cells transduced with the corresponding ATFs; ATF-126NOVP is a control ATF-126 lacking the VP64 activator domain; PMXVP64-SS is a control vector expressing the VP64 activator domain only.

Figure 3 ATFs induce apoptosis and reduce cell invasion in the NCI-H157 NSCLC cell line. (A) ATF-97 and ATF-126 induce apoptosis in NCI-H157 cells. The percentage of apoptosis was quantitatively analyzed in untransduced cells, control cells and in ATF-transduced cells using an Annexin-V staining. Apoptosis was measured 96 h post-transduction. Data represents an average of three independent experiments (**p < 0.01, as determined by the Student's t-test). (B) ATFs downregulate cell invasion in NCI-H157 cells in matrigel invasion assays. Left panel shows a representative picture of invasive cells. Right panel shows the quantification of invasive cells. Experiments were run in triplicate and data represents an average of three different biological replicates (**p < 0.01, as determined by the Student's t-test). (C) In vitro colony formation assay in soft agar. The morphology of colonies of control and ATF-transduced cells are indicated. (D) 3D Matrigel culture assay illustrating that ATF-97- and ATF-126-transduced cells form colonies with an organized spheroid structure. (E) Expression of E-CADHERIN by qRT-PC R in control and ATF-transduced cells. Data was normalized to the untransduced cell line. Experiments were run in triplicate and data represent the mean ± SD three independent experiments (**p < 0.01, as determined by Student's t-test). NCI-H157 refers to untransduced cells; control, cells transduced with an empty retroviral vector; ATF-97, ATF-126 and ATF-452, cells transduced with the corresponding ATFs; ATF-126NOVP is a control ATF-126 lacking the VP64 activator domain.
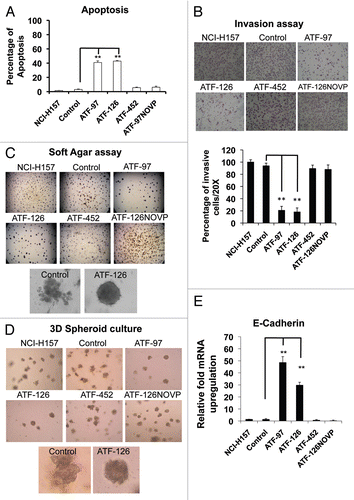
Figure 3 ATFs induce apoptosis and reduce cell invasion in the NCI-H157 NSCLC cell line. (A) ATF-97 and ATF-126 induce apoptosis in NCI-H157 cells. The percentage of apoptosis was quantitatively analyzed in untransduced cells, control cells and in ATF-transduced cells using an Annexin-V staining. Apoptosis was measured 96 h post-transduction. Data represents an average of three independent experiments (**p < 0.01, as determined by the Student's t-test). (B) ATFs downregulate cell invasion in NCI-H157 cells in matrigel invasion assays. Left panel shows a representative picture of invasive cells. Right panel shows the quantification of invasive cells. Experiments were run in triplicate and data represents an average of three different biological replicates (**p < 0.01, as determined by the Student's t-test). (C) In vitro colony formation assay in soft agar. The morphology of colonies of control and ATF-transduced cells are indicated. (D) 3D Matrigel culture assay illustrating that ATF-97- and ATF-126-transduced cells form colonies with an organized spheroid structure. (E) Expression of E-CADHERIN by qRT-PC R in control and ATF-transduced cells. Data was normalized to the untransduced cell line. Experiments were run in triplicate and data represent the mean ± SD three independent experiments (**p < 0.01, as determined by Student's t-test). NCI-H157 refers to untransduced cells; control, cells transduced with an empty retroviral vector; ATF-97, ATF-126 and ATF-452, cells transduced with the corresponding ATFs; ATF-126NOVP is a control ATF-126 lacking the VP64 activator domain.

Figure 4 ATF-126 inhibits metastatic dissemination in the NSCLC NCI-H157 cell line stably expressing a luciferase reporter (Luc) in vivo. Top panel; in vivo Bioluminescence Imaging of control mice showing metastasis in the brain and spine at week six after receiving an intracardiac injection of 1 × 10⁵ NCI-H157 cells transduced with control vector (empty retroviral vector). Bottom panel; Bioluminescence Imaging of ATF-126-injected mice twelve weeks after receiving an intracardiac injection of 1 × 10⁵ NCI-H157 cells transduced with ATF-126 retroviral vector. Differences between the two groups were calculated using the Wilcoxon rank sum test with the level of significance of p ≤ 0.1.
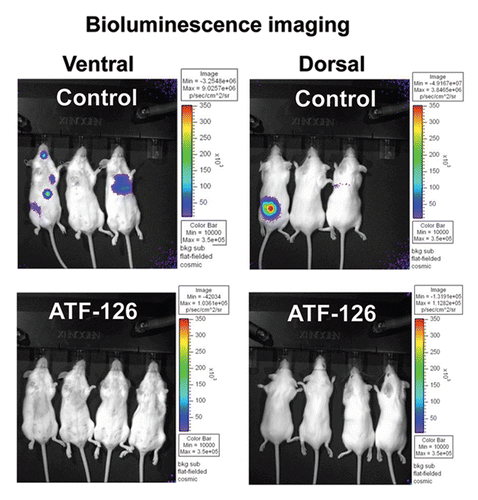
Figure 4 ATF-126 inhibits metastatic dissemination in the NSCLC NCI-H157 cell line stably expressing a luciferase reporter (Luc) in vivo. Top panel; in vivo Bioluminescence Imaging of control mice showing metastasis in the brain and spine at week six after receiving an intracardiac injection of 1 × 10⁵ NCI-H157 cells transduced with control vector (empty retroviral vector). Bottom panel; Bioluminescence Imaging of ATF-126-injected mice twelve weeks after receiving an intracardiac injection of 1 × 10⁵ NCI-H157 cells transduced with ATF-126 retroviral vector. Differences between the two groups were calculated using the Wilcoxon rank sum test with the level of significance of p ≤ 0.1.

Figure 5 ATFs demethylate the MASPIN promoter in the NCI-H157 cell line. (A) Methylation status of the MASPIN promoter in untransduced NCI-H157 cells. The X-axis represent the nucleotide position relative to the first methionine and Y-axis the percentage of methylation along the MASPIN proximal promoter region (495 to +134). The frequencies of 5-Methylcytosine were obtained by sodium bisulfite genomic sequencing of the MASPIN promoterCitation33 Known transcription factor binding sites were included (p53-binding sites as well as ATF-binding sites). Red nucleotides indicate the methylated cytosines in the ATF-binding sites. (B) Schematic representation of ATF-126 and ATF-97 illustrating the positioning of the six zinc finger (ZF-97 and ZF-126) DNA binding domains and the VP64 effector domain (blue circles) in the promoter. (C) Methylation status of the MASPIN promoter in ATF-97- and ATF-126-transduced cells.
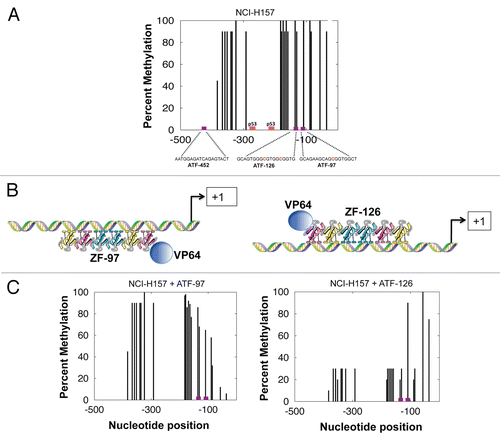
Figure 5 ATFs demethylate the MASPIN promoter in the NCI-H157 cell line. (A) Methylation status of the MASPIN promoter in untransduced NCI-H157 cells. The X-axis represent the nucleotide position relative to the first methionine and Y-axis the percentage of methylation along the MASPIN proximal promoter region (495 to +134). The frequencies of 5-Methylcytosine were obtained by sodium bisulfite genomic sequencing of the MASPIN promoterCitation33 Known transcription factor binding sites were included (p53-binding sites as well as ATF-binding sites). Red nucleotides indicate the methylated cytosines in the ATF-binding sites. (B) Schematic representation of ATF-126 and ATF-97 illustrating the positioning of the six zinc finger (ZF-97 and ZF-126) DNA binding domains and the VP64 effector domain (blue circles) in the promoter. (C) Methylation status of the MASPIN promoter in ATF-97- and ATF-126-transduced cells.

Figure 6 ATFs synergize with 5-Aza-2′-dC to reactivate MASPIN in NSCLC Low-MASPIN expressing cell lines. Non-transduced and transduced cells were treated with 5 µM of 5-Aza-2′-dC for 48 h. MASPIN mRNA expression levels were measured by quantitative real-time PCR. MASPIN protein expression in NCI-H157 cells was determined by western blot. Experiments were run in triplicate and data represent the mean ± SD three independent experiments (*p < 0.05, as determined by Student's t-test). NCH-A549, NCH-H226, NCH-H1703 and NCH-H157 are referred to as “cell line;” ATF-97, ATF-126 and ATF-452, represent cells transduced with the corresponding ATFs.
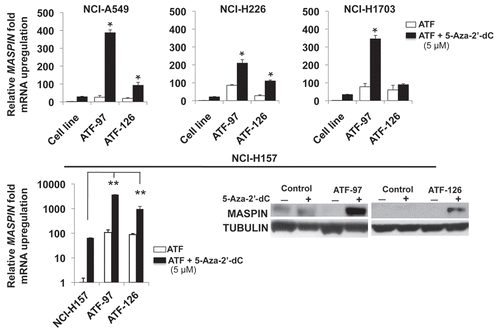
Figure 6 ATFs synergize with 5-Aza-2′-dC to reactivate MASPIN in NSCLC Low-MASPIN expressing cell lines. Non-transduced and transduced cells were treated with 5 µM of 5-Aza-2′-dC for 48 h. MASPIN mRNA expression levels were measured by quantitative real-time PCR. MASPIN protein expression in NCI-H157 cells was determined by western blot. Experiments were run in triplicate and data represent the mean ± SD three independent experiments (*p < 0.05, as determined by Student's t-test). NCH-A549, NCH-H226, NCH-H1703 and NCH-H157 are referred to as “cell line;” ATF-97, ATF-126 and ATF-452, represent cells transduced with the corresponding ATFs.
Supplemental material

Additional material

Download Zip (110.9 KB)

Reprints and Corporate Permissions

Please note: Selecting permissions does not provide access to the full text of the article, please see our help page How do I view content?

To request a reprint or corporate permissions for this article, please click on the relevant link below:

Academic Permissions

Please note: Selecting permissions does not provide access to the full text of the article, please see our help page How do I view content?

Obtain permissions instantly via Rightslink by clicking on the button below:

If you are unable to obtain permissions via Rightslink, please complete and submit this Permissions form. For more information, please visit our Permissions help page.