Figures & data
Figure 1 Methylation of the three marker loci in CLL samples. Examples of methylation analysis using COBRA assays for (A) CD38, (B) HOXA4 and (C) BTG4. Above each is a diagram of the locus analyzed indicating the position of the first exon and start of transcription (large arrow), the position of the CpG island (thick black line), the positions of the primers used (small horizontal arrows) and the positions of the restriction enzymes for the digest used in each example (small vertical arrows; H, HinFI and T, TaqI). The positions of bands representing methylated and unmethylated DNA are indicated by arrows and the controls used are indicated above their respective lanes [no DNA (water), 100, 66 and 33% (in vitro methylated DNA), diluted into PBL (peripheral blood leukocytes) DNA as required and PBL]. Under each sample lane an M or U indicates if the sample was considered methylated (M) or unmethylated (U) for the purposes of the subsequent analysis. In (A) samples were either high (>30%) or low (<30%) for CD38 expression. In (C) samples were either positive (11q23 del) or negative (no del) for the 11q23 deletion. Primers used were as previously described for HOXA4,Citation10 Forward 5′-GGT GTT AAG GTT AGT TGT TTT TGA AAG, Reverse 5′-ACT CTC TAA AAA AAC CCA ACT CTA TC for CD38 and Forward 5′-GTT TGG TAT TTT TGG GGG TTA TGG, Reverse 5′-CAA TAC AAT CAA CTA ATA ACA CTA CCT AC for BTG4.
![Figure 1 Methylation of the three marker loci in CLL samples. Examples of methylation analysis using COBRA assays for (A) CD38, (B) HOXA4 and (C) BTG4. Above each is a diagram of the locus analyzed indicating the position of the first exon and start of transcription (large arrow), the position of the CpG island (thick black line), the positions of the primers used (small horizontal arrows) and the positions of the restriction enzymes for the digest used in each example (small vertical arrows; H, HinFI and T, TaqI). The positions of bands representing methylated and unmethylated DNA are indicated by arrows and the controls used are indicated above their respective lanes [no DNA (water), 100, 66 and 33% (in vitro methylated DNA), diluted into PBL (peripheral blood leukocytes) DNA as required and PBL]. Under each sample lane an M or U indicates if the sample was considered methylated (M) or unmethylated (U) for the purposes of the subsequent analysis. In (A) samples were either high (>30%) or low (<30%) for CD38 expression. In (C) samples were either positive (11q23 del) or negative (no del) for the 11q23 deletion. Primers used were as previously described for HOXA4,Citation10 Forward 5′-GGT GTT AAG GTT AGT TGT TTT TGA AAG, Reverse 5′-ACT CTC TAA AAA AAC CCA ACT CTA TC for CD38 and Forward 5′-GTT TGG TAT TTT TGG GGG TTA TGG, Reverse 5′-CAA TAC AAT CAA CTA ATA ACA CTA CCT AC for BTG4.](/cms/asset/53fe72d3-aff2-4c92-ac2e-99d47cc4e35d/kepi_a_10914038_f0001.gif)
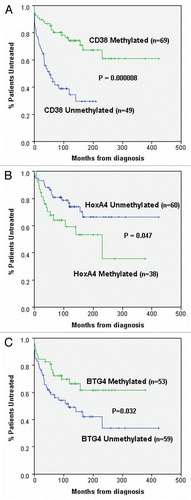
Figure 2 All three markers individually exhibit correlations with patient outcome. Kaplan-Meier graphs are shown to assess the relationship between methylation of (A) CD38, (B) HOXA4 and (C) BTG4 and TFT in CLL patients. In (A and C) all patients are included; however, in (B) only stage A patients are included. Methylation of CD38 and BTG4 were significantly correlated with longer TFT, whereas methylation of HOXA4 was associated with reduced TFT. Kaplan-Meier graphs were generated using the SPSS statistical software package (version 17) and p values were derived using the log rank test.

Figure 3 Use of methylation score identifies a subset of patients with reduced TFT from good prognostic groups. (A and B) Kaplan-Meier graphs showing the correlation between methylation score and TFT in all patients or Binet stage A only CLL patients, respectively. The predictive value of the combined score is greater than any of the single markers. (C and D) Kaplan-Meier graphs showing the correlation between methylation score and IGHV gene mutational status and TFT in all patients or stage A only CLL patients, respectively. Patients were stratified into four groups depending on both methylation score and IGHV gene mutational status. However only three groups are displayed as the fourth group [IGHV unmutated and methylation score low risk contained very few patients (3)]. (E and F) Kaplan-Meier graph showing the correlation between methylation score and CD38 expression and TFT in all patients or stage A only CLL patients, respectively. Patients were stratified into four groups depending on both methylation score and CD38 expression. However, again only three groups are displayed as the fourth group [CD38 expression positive and methylation score low risk contained very few patients (2)].
![Figure 3 Use of methylation score identifies a subset of patients with reduced TFT from good prognostic groups. (A and B) Kaplan-Meier graphs showing the correlation between methylation score and TFT in all patients or Binet stage A only CLL patients, respectively. The predictive value of the combined score is greater than any of the single markers. (C and D) Kaplan-Meier graphs showing the correlation between methylation score and IGHV gene mutational status and TFT in all patients or stage A only CLL patients, respectively. Patients were stratified into four groups depending on both methylation score and IGHV gene mutational status. However only three groups are displayed as the fourth group [IGHV unmutated and methylation score low risk contained very few patients (3)]. (E and F) Kaplan-Meier graph showing the correlation between methylation score and CD38 expression and TFT in all patients or stage A only CLL patients, respectively. Patients were stratified into four groups depending on both methylation score and CD38 expression. However, again only three groups are displayed as the fourth group [CD38 expression positive and methylation score low risk contained very few patients (2)].](/cms/asset/47d0fe32-0747-49ad-bd0d-ff6cce45f595/kepi_a_10914038_f0003.gif)
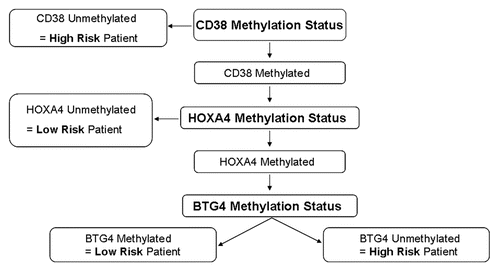
Figure 4 Algorithm used to define high and low risk based on methylation of the three marker genes. Information from the three marker genes was combined using an algorithm as shown. This was designed to give greater weight to CD38 methylation status as this correlated most strongly with outcome when used in isolation. Patients were defined as methylation low risk if their samples exhibited methylation at CD38 and the low risk variant at least one of the other two genes (i.e., either HOXA4 unmethylated and/or BTG4 methylated). Patients lacking CD38 methylation or with CD38 methylated but high risk variants at both of the other two genes (i.e., HOXA4 methylated and BTG4 unmethylated) were defined as methylation high risk.

Table 1 Methylation frequencies in CLL samples
Table 2 Multivariate Cox regression analysis