Figures & data
Figure 1 BaP increases H3K4 trimethylation and H3K9 acetylation events and modulates recruitment of DNMT1 to the L1 promoter. HeLa cells treated with DMSO vehicle or 3 µM BaP for 12 hours were formaldehyde-cross-linked and chromatin processed for ChIP assays. Four µg of antisera were used for each immunoprecipitation with antibodies targeting different histone modifications or transcription factors as shown and purified DNA subjected to real time PCR. (A) Real time PCR was performed using primers targeting the L1 promoter (5′UTR). (B) Real time PCR for DNA samples from ChIP assays with antibodies shown was performed using primers targeting the L1 promoter (5′UTR). Isotype-matched IgG control for all reactions (A and B) is shown in (A). The results shown are representative of experiments performed in triplicate for each sample and repeated 3×. Calculations for L1 promoter sequence enrichment within ChIP samples was performed according to the SABiosciences ChIP-qPCR Data Analysis manual (www.sabiosciences.com/chipqpcrresource.php) and plotted as a function of percent enrichment relative to input (% input) chromatin. Statistical analyses done using ANOVA (* indicates statistically significant differences, p < 0.05).
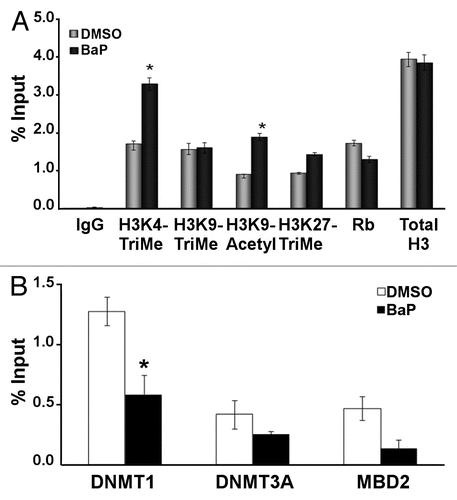
Figure 2 BaP causes hypomethylation of the human and mouse L1 promoters. (A) Schematic showing CpG island and the location of MS-PCR primers used for analyses in HeLa cells. The mouse primers targeted similar locations on the mouse L1MdA5 promoter (B). CpG positions analyzed on the human L1RP promoter and putative transcription factor binding sites as identified by MatInspector (www.genomatrix.de). Sequencing primers were chosen such that specific CpG spots could be analyzed via pyrosequencing. (C) HeLa cells were treated with DMSO vehicle or 3 µM BaP for 96 h, genomic DNA extracted, treated with bisulfite and pyrosequenced. Percent cytosine methylation for the indicated CpG loci was thus determined, and statistic analyses done using ANOVA (* indicates statistically significant differences, p < 0.05). The results shown are representative of three independent experiments. Each CpG locus was analyzed at least twice for each pyrosequencing run.
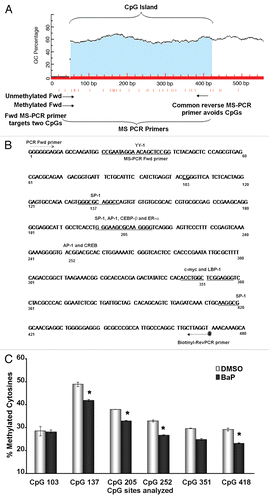
Figure 3 BaP-induced L1 DNA hypomethylation is observed at the 96 h time point. HeLa cells were treated with BaP for 12, 24, 48, 72 and 96 h, DNA harvested, bisulfite treated, PCR amplified (with a biotin-tagged reverse PCR primer) and pyrosequenced using sequencing primers specific for CpG loci 205 and 252. (A) shows a quantitative representation of pyrosequencing analyses for CpG 205. (B) shows the same for CpG252. Results are shown as percent cytosine methylation and statistic analyses done using ANOVA (* indicates statistically significant differences, p < 0.05). The data are representative of three independent experiments with each CpG locus analyzed at least twice for each pyrosequencing run.
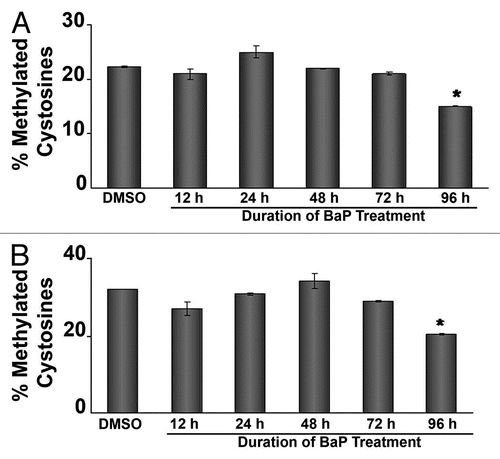
Figure 4 siRNA targeting DNMTs decreases L1 promoter methylation and increases L1 expression. HeLa cells were transfected with 50 nM siRNA targeting DNMT1, DNMT3A or DNMT3B, RNA was extracted and cDNA prepared for qPCR assays. (A) validation of DNMT mRNA downregulation via real time PCR. (B) Western blot experiments using 20 µg of total cellular protein lysate from HeLa cells transfected with siRNA against DNMT1. GAPDH was used as a loading control. (C) Western blot experiments using 20 µg of total cellular protein lysate from HeLa cells transfected with siRNA against DNMT3A. GAPDH was used as a loading control. (D) siRNA targeting DNMTs decreases L1 promoter methylation at several CpG sites. HeLa cells were transfected with 50 nM siRNA targeting DNMT1, DNMT3A or DNMT3B. As a control for DNA methylation status, the demethylating agent 5-aza-2′-deoxycytidine (5-AzaC) was used. DNA was isolated and pyrosequenced for quantitative analyses of DNA methylation using sequencing primers targeting six unique CpG dinucleotides. (E) siRNA targeting DNMT1 increases L1 transcripts. HeLa cells pretreated with 50 nM siRNA targeting DNMTs and 48 h later mRNA levels of LINE 1 ORF 1 and ORF 2 were measured by real time PCR. For all experiments involving real time PCR, relative quantitative analyses were done using the Livak method of ΔΔCt and statistic analyses were done using ANOVA (* indicates statistically significant differences, p < 0.05). Each experiment was run with three replicates and repeated at least 2×.
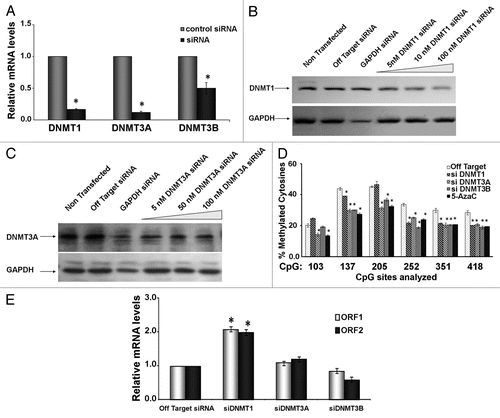
Figure 5 BaP targets DNMT1 for degradation via a proteasome-dependent pathway. (A) HeLa cells were treated with vehicle DMSO or 3 µM BaP for 48 h. Forty micrograms of total protein extract were resolved on a 4–12% gradient SDS PAGE. Membranes were probed for DNMT1 and DNMT3A. GAPDH was used as loading control. (B) MG132 inhibits degradation of DNMT1 following BaP treatment. HeLa cells pretreated with 1 µM MG132 for 3 h prior to DMSO vehicle or 3 µM BaP treatment for an additional 48 h were lysed and total protein used for western blot assays with the indicated antisera. AHR (control) is a protein targeted for degradation by BaP. (C) Inhibition of proteasomal degradation of DNMT1 results in reversal of BaP mediated hypomethylation at CpGs on the L1 promoter. Cells subjected to pharmacological treatment as in (B) were exposed to DMSO vehicle or 3 µM BaP for 96 h followed by DNA pyrosequencing of CpG loci 205, 252 and 351. Results are shown as percent cytosine methylation.
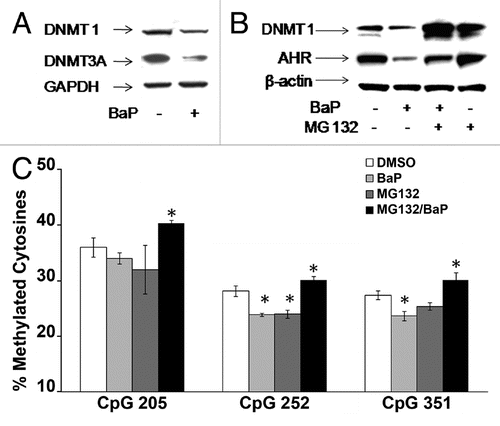
Figure 6 MG132 alters histone epigenetic modifications. HeLa cells were treated with 1 µM MG132 followed by a 12 h treatment with DMSO vehicle or 3 µM BaP. Cells were processed for ChIP assays using 25 µg of chromatin per immunoprecipitation. Real time PCR for DNA samples from ChIP assays with antibodies shown was performed using primers targeting the L1 promoter (5′UTR). Isotype-matched IgG control was used to control for non-specific enrichment of L1 DNA sequences. The results shown are representative of experiments with four replicate samples and repeated two independent times. Calculations for L1 promoter sequence enrichment within ChIP samples was performed according to the SABiosciences ChIP-qPCR Data Analysis manual (www.sabiosciences.com/chipqpcrresource.php) and plotted as a function of percent enrichment relative to input (% input) chromatin.
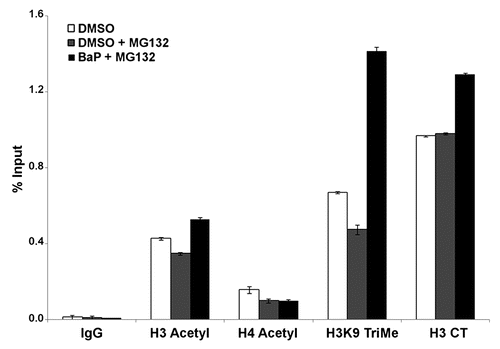
Figure 7 Proposed model for epigenetic crosstalk in the regulation of L1 expression. Early events in L1 expression involve histone modifications with enrichment for H3K4Me3 and H3K9Ac which are hallmarks of active gene expression. At this phase we observe reduced DNMT RNA and protein levels probably due to degradation. As cells divide with reduced levels of DNA methyltransferase, L1 promoter becomes hypomethylated.
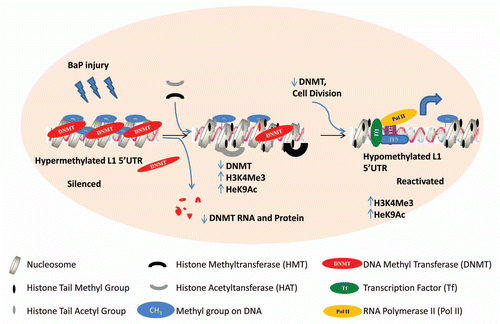
Table 1 Pyrosequencing primers and dispensation order
Table 2 Transcription factor binding sites proximal to CpG dinucleotides analyzed