Figures & data
Figure 1 Reductive methylation of histone H3. (A) The N-terminus of H3 is shown as being un- (green), mono- (red) or di- (blue) methylated at lysine 4. On a MALDI mass spectrometer, addition of a single methyl group is recorded as an addition of 14 Da while addition of two methyl groups is recorded as an addition of 28 Da. Variation in the chemical composition of each peptide leads to differential ionization making quantification complex. (B) Reductive methylation converts all lysine residues to the di-methyl state, which causes all peptides to be identical in mass and ionize similarly; however, it also makes the original methylation states indistinguishable. (C) The use of heavy formaldehyde in the reductive methylation reaction allows retention of the identity of the original, isotopically light, methylation (open circles). In addition, any lysines not already modified will undergo reductive methylation forcing them to an isotopically heavy di-methyl state (closed circles). This conversion allows each peptide to ionize the same while retaining the identity of the original peptide (light vs. heavy methylation).
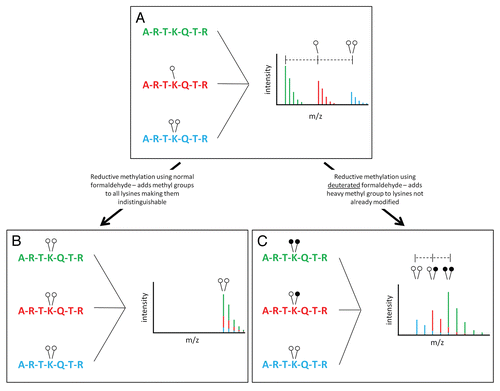
Figure 2 Efficiency and dynamic range of MassSQUIRM. (A) A synthetic peptide containing four unmodified lysine residues (lower part) was exposed to reductive methylation using either light formaldehyde (middle part) or heavy formaldehyde (top part). The resulting spectra show a ∼100% conversion of all lysine residues, as well as the N-terminus, to the di-methyl state. Heavy formaldehyde showed a peak 20 Da larger than that of the light formaldehyde as would be expected. (B) MassSQUIRM is efficient in-gel with full-length proteins. A recombinant version of full-length human H3.2 was subjected to in-gel tryptic digestion either with (top part) or without (bottom part) prior in-gel isotopically heavy reductive methylation. Resulting peptides were analyzed by MALDI-TOF mass spectrometry. A ∼100% conversion to heavy di-methylated peptide was observed. (C) Un-, mono- and di-methylated synthetic peptides were normalized to a 1:1:1 mixture and mono-methylated peptide concentration was varied at the theoretical ratios indicated (untreated sample). The same peptide mixtures were separately treated with MassSQUIRM (treated sample). The linear dynamic range was determined to be 1:8 for both treated (◆) and untreated (■) samples. Open circles indicate light methylation while closed circles indicate heavy methylation.
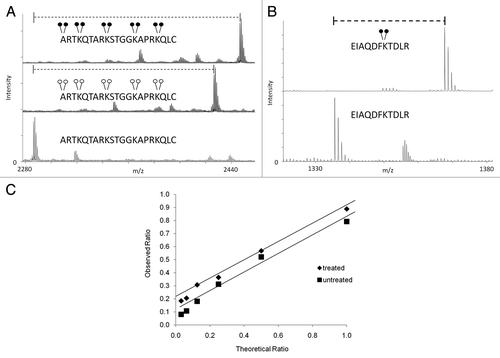
Figure 3 MassSQUIRM accurately corrects for differences in ionization. (A) Equimolar amounts of an H3K27 peptide with 0, 1 or 2 methyl groups were mixed and analyzed by MALDI mass spectrometry. The un-, mono- and di-methylated peptides ionize at different efficiencies. (B) A synthetic peptide representing H3K4me2 was incubated with the histone demethylase LSD1 and the resulting peptides were analyzed by conventional mass spectro-metry. (C) The same reaction was performed as in (B) but peptides were analyzed using MassSQUIRM. (D) MassSQUIRM allows quantification of mono-methyl peptide species that was omitted in conventional mass spectrometry analysis due to differential ionization seen in (A). Open circles indicate light methylation while closed circles indicate heavy methylation.
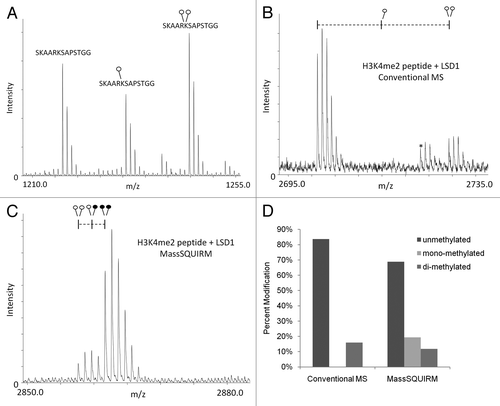
Figure 4 MassSQUIRM can be used to successfully quantify differentially modified peptides. (A) A di-methylated synthetic peptide was analyzed using mass spectrometry and the resulting isotopic envelope was used to determine r1 and r2 from Equationequations 3(3)
(3) and Equation4
(4)
(4) . This peptide corresponds to that noted in blue in (inset). (B) The same synthetic peptide was incubated with 125 ng GST-LSD1 in demethylase buffer for two hours at 37°C. Samples were then subjected to MassSQUIRM analysis. A mixed population of overlapping peaks represents three different methylation states as seen in (inset). Peptides initially mono-methylated occur at a mass 2 Da heavier than di-methylated peptides due to the addition of one heavy methyl group during reductive methylation. Similarly, peptides initially unmodified will occur 4 Da heavier than di-methylated peptides due to the addition of two heavy methyl groups. Areas under the monoisotopic peaks were noted as A1, A2 and A3. These values were used to determine Equationequations 5
(5)
(5) –Equation7
(7)
(7) , which take into account the isotopic overlap noted in (A). Open circles indicate light methylation while closed circles indicate heavy methylation.
 , which take into account the isotopic overlap noted in (A). Open circles indicate light methylation while closed circles indicate heavy methylation.](/cms/asset/ba4c1e64-100b-48fb-8706-c4ea784be143/kepi_a_10914531_f0004.gif)
Figure 5 LSD1 activity can be measured using MassSQUIRM. (A) 0.25 µg of a synthetic H3K4me2 peptide was subjected to varying concentrations of recombinant LSD1 in demethylase buffer for 2 h at 37°C and analyzed with MassSQUIRM. (B) Quantification of methylation levels was determined using r1 and r2 values from peptide alone samples (bottom panel) and Equationequations 5(5)
(5) –Equation7
(7)
(7) . Open circles indicate light methylation while closed circles indicate heavy methylation.
 . Open circles indicate light methylation while closed circles indicate heavy methylation.](/cms/asset/0530c4fd-abf3-461b-b32f-ce0ec59b8cee/kepi_a_10914531_f0005.gif)
Figure 6 LSD1 inhibitor efficiency can be measured quantitatively using MassSQUIRM. (A) Demethylation reactions were carried out using 125 ng of LSD1 and 0.25 µg H3K4me2 peptide in the presence (top part) or absence (middle part) of 16.7 mM of the LSD1 inhibitor phenylethylhydrazine. (B) Quantification of methylation levels was determined using r1 and r2 values from peptide alone samples (A, bottom part) and Equationequations 5(5)
(5) –Equation7
(7)
(7) . Open circles indicate light methylation while closed circles indicate heavy methylation.
 . Open circles indicate light methylation while closed circles indicate heavy methylation.](/cms/asset/89360544-d393-46a8-b40b-cdf330a324f5/kepi_a_10914531_f0006.gif)