1,937
Views
117
CrossRef citations to date
0
Altmetric
Research Paper

Infant growth restriction is associated with distinct patterns of DNA methylation in human placentas

Pages 920-927 | Received 30 Mar 2011, Accepted 16 May 2011, Published online: 01 Jul 2011

Figures & data

Figure 1 Data analysis schematic. Placenta samples were split into training and testing datasets matched with equal proportions of SGA or IUGR samples in each group. Semi-Supervised Recursively Partitioned Mixture Model data analysis was used to rank the methylation of each locus as associated with SGA or IUGR diagnosis.
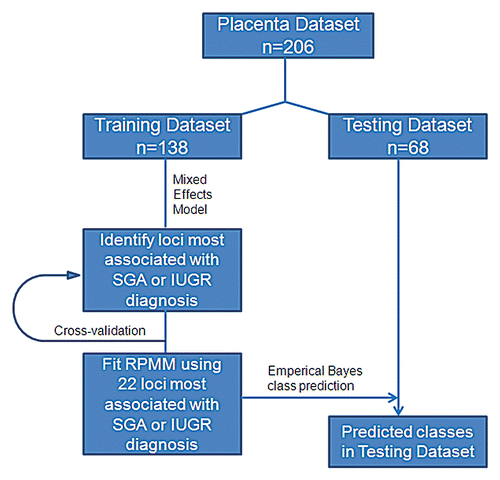
Figure 1 Data analysis schematic. Placenta samples were split into training and testing datasets matched with equal proportions of SGA or IUGR samples in each group. Semi-Supervised Recursively Partitioned Mixture Model data analysis was used to rank the methylation of each locus as associated with SGA or IUGR diagnosis.

Figure 2 Association between methylation and birth weight. Volcano plot examining the association between SGA or IUGR diagnosis and methylation extent across all 26,486 autosomal loci examined. Negative log-transformed p values generated from the linear mixed effects model are plotted against the model coefficient (adjusting for gestational age). The area above the solid blue line indicates a p value < 0.05. This coefficient represents the magnitude of the effect of SGA or IUGR status on methylation.
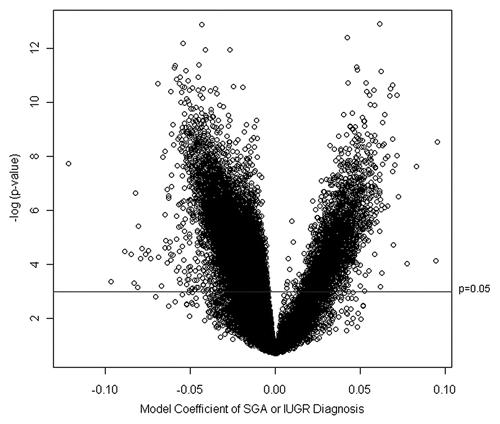
Figure 2 Association between methylation and birth weight. Volcano plot examining the association between SGA or IUGR diagnosis and methylation extent across all 26,486 autosomal loci examined. Negative log-transformed p values generated from the linear mixed effects model are plotted against the model coefficient (adjusting for gestational age). The area above the solid blue line indicates a p value < 0.05. This coefficient represents the magnitude of the effect of SGA or IUGR status on methylation.

Figure 3 Methylation profiles defined by 22 loci are associated with infant growth status. The Recursively Partitioned Mixture Model-based classification of placenta samples (columns) based on 22 loci (rows) is depicted on the heatmap, with the five classes separated by red lines in the (A) training and (B) testing series. The prevalence of growth restriction or normal births within each of the classes is shown below the heatmap. The Chi-square p value listed below the tables indicates a significant difference in the proportion of SGA participants between classes for both training and testing datasets.
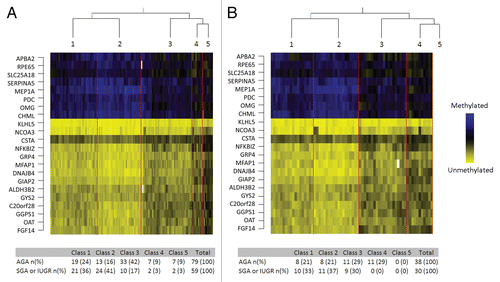
Figure 3 Methylation profiles defined by 22 loci are associated with infant growth status. The Recursively Partitioned Mixture Model-based classification of placenta samples (columns) based on 22 loci (rows) is depicted on the heatmap, with the five classes separated by red lines in the (A) training and (B) testing series. The prevalence of growth restriction or normal births within each of the classes is shown below the heatmap. The Chi-square p value listed below the tables indicates a significant difference in the proportion of SGA participants between classes for both training and testing datasets.

TABLE 1 Characteristics of the subjects involved in the study

Table 2 Multivariable analysis of the association between predicted SSRPMM class for the observations in the test data and SGA or IUGR classification; controlled for infant gender, maternal age, delivery method, parity, maternal BMI at time of delivery and maternal smoking during pregnancy

Table 3 Gene set enrichment analysis (GSEA) of KEGG pathways over-represented amongst loci associated with SGA or IUGR status

Table 4 Gene set enrichment analysis (GSEA) of transcription factor binding sites over-represented within 1 kb of loci associated with SGA or IUGR status

Supplemental material

Additional material

Download Zip (2.1 MB)

Reprints and Corporate Permissions

Please note: Selecting permissions does not provide access to the full text of the article, please see our help page How do I view content?

To request a reprint or corporate permissions for this article, please click on the relevant link below:

Academic Permissions

Please note: Selecting permissions does not provide access to the full text of the article, please see our help page How do I view content?

Obtain permissions instantly via Rightslink by clicking on the button below:

If you are unable to obtain permissions via Rightslink, please complete and submit this Permissions form. For more information, please visit our Permissions help page.