Figures & data
Figure 1 Overview of the analytic strategy for this study. Methylation data for 26,486 autosomal CpGs was assayed for each of 205 blood specimens by the Infinium HumanMethylation27k BeadArray. Three complementary approaches were used to assess the association between DNA methylation and age, sex and select environmental exposures, while taking into account variation in DNA sequence features of each CpG: (1) unsupervised clustering of CpGs by recursively partitioned mixture modeling (RPMM) into 32 CpG classes based on like methylation patterns, followed by evaluation of an association of mean methylation of the CpGs for each resultant class with age, gender or exposures; (2) clustering of CpGs into 41 classes based on bioinformatic attributes (CpG sequence features), again followed by evaluation of an association of mean methylation of the CpGs for each resultant class with age, gender or exposures; and (3) a marginal-model based analysis (no clustering), assessing interactions between DNA sequence features and age, gender and exposures, with respect to methylation.
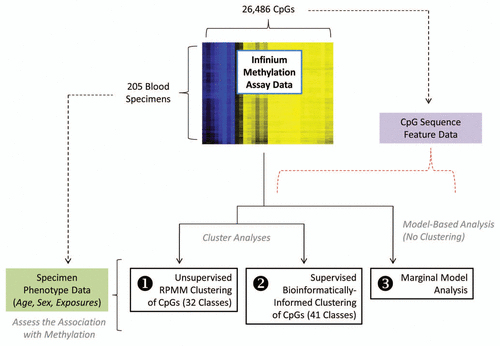
Figure 2 Adjusted association of exposures with unsupervised RPMM class methylation. The colored dots indicate the degree of average class methylation. The y-axis represents the t-statistic for the association of class methylation and the corresponding exposure from the multiple regression models, while the 32 CpG classes are depicted on the x-axis. The p value for the omnibus test (first difference test) of significance for the association of each exposure and average class methylation is found at the top left of the corresponding exposure plot. The red dotted lines represent the 95th percentile of the permutation distribution of the maximum absolute value (over 32 classes) of the regression coefficient t-statistics as a control for multiple comparisons. Note: age was adjusted for gender; gender was adjusted for age and hair dye use; all other models were adjusted for age and gender. *Restricted to ever-smokers. **Compared to non-drinkers (zero alcoholic drinks per week).
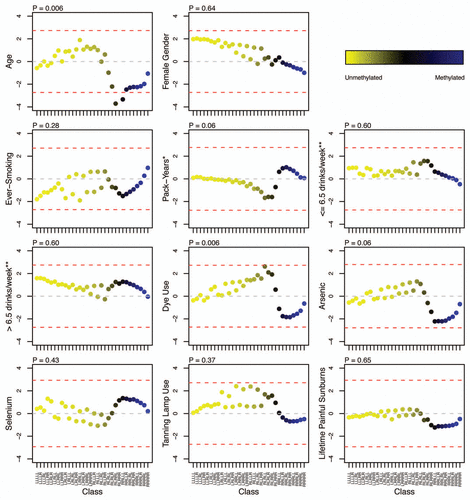
Figure 3 Frequency of sequence features associated with unsupervised RPMM class CpG loci. Classes are represented on each plot by the colored dots, which indicate the degree of average class methylation. The y-axis represents the frequency of CpG loci in each class associated with the sequence feature of interest, while the 32 CpG classes are depicted on the x-axis. Abbreviations: CGI = CpG island; PcG Target = located in a polycomb group protein target gene; TFBS, located within 1 kb of a transcription factor binding site; LINE, long interspersed nuclear element; MIR, mammalian wide-interspersed repeat element.
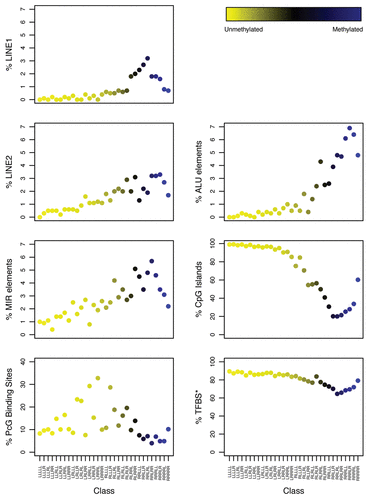
Figure 4 Adjusted association of exposures with bioinformatically-derived CpG class methylation. The colored dots indicate the degree of average class methylation. The y-axis represents the t-statistic for the association of class methylation and the corresponding exposure from the multiple regression models, while the 41 bioinformatically-derived Cp6 classes are listed numerically on the x-axis; the bioinformatic attributes corresponding to the numbers are provided in Supplemental Table S3. The p-value for the omnibus test (supremum) of significance for the association of each exposure and average class methylation is found at the top left the corresponding exposure plot. The red dotted lines represent the 95th percentile of the permutation distribution of the maximum absolute value (over 32 classes) of the regression coefficient t-statistics as a control for multiple comparisons. Note: age was adjusted for gender; gender was adjusted for age and hair dye use; all other models were adjusted for age and gender. There were 8 classes significantly associated with age: (12) CGI|MIR; (16) PcG|TFBS; (20) PcG; (23) TFBS; (24) PcG|MIR|TFBS; (27) MIR|TFBS; (29) CGI|PcG|LINE2; (31) LINE2|TFBS. Abbreviations: CGI = CpG island; PcG = located in a polycomb group protein target gene; TFBS = located within 1 kb of a transcription factor binding site; LINE = long interspersed nuclear element; MIR = mammalian wide-interspersed repeat element. *Restricted to ever-smokers. **Compared to non-drinkers (zero alcoholic drinks per week).
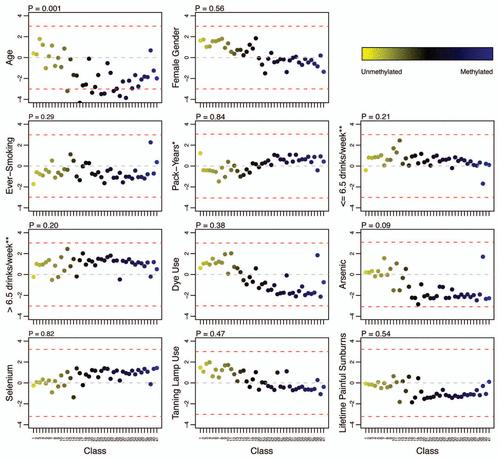
Table 1 Omnibus tests of association for exposures and unsupervised RPMM CpG class methylation
Table 2 Omnibus tests of association for exposures and bioinformatically-derived CpG class methylation
Table 3 Summary of results for the marginal model-based assessment of the association of exposures and methylation, overall and by sequence feature