1,076
Views
20
CrossRef citations to date
0
Altmetric
Research Paper

The depletion of DNA methyltransferase-1 and the epigenetic effects of 5-aza-2’deoxycytidine (decitabine) are differentially regulated by cell cycle progression

Pages 1021-1028 | Received 14 Apr 2011, Accepted 09 Jun 2011, Published online: 01 Aug 2011

Figures & data

Figure 1 Cell cycle progression is unnecessary for depletion of DNMT1 enzyme in HCT 116 cells exposed to decitabine. (A) Western immunoblots of DNMT1 enzyme and β-tubulin. Serum-starved, growing or confluent HCT116 p53+/+ cells were treated once with 300 nM decitabine or 1 µM 6-azacytidine. DNMT1 was detected in the cell lysates by western immunoblotting. β-tubulin served as a loading control. The blots are representative of five experiments for the growing and confluent cells and two experiments for the starved cells. (B) Time course of DNMT1 depletion by decitabine. Plots of the relative depletion of DNMT1 versus time were based on the densitometry of DNMT1 immunoblots normalized to β-tubulin. *Denotes statistical significance (p < 0.05), error bars are 1 SD (n = 5 confluent and growing, n = 2 starved). The Table shows the t½ ± SD of DNMT1 depletion for each experimental condition and the corresponding percentage of the cell population in s-phase.
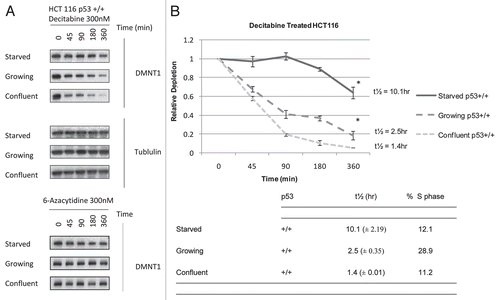
Figure 1 Cell cycle progression is unnecessary for depletion of DNMT1 enzyme in HCT 116 cells exposed to decitabine. (A) Western immunoblots of DNMT1 enzyme and β-tubulin. Serum-starved, growing or confluent HCT116 p53+/+ cells were treated once with 300 nM decitabine or 1 µM 6-azacytidine. DNMT1 was detected in the cell lysates by western immunoblotting. β-tubulin served as a loading control. The blots are representative of five experiments for the growing and confluent cells and two experiments for the starved cells. (B) Time course of DNMT1 depletion by decitabine. Plots of the relative depletion of DNMT1 versus time were based on the densitometry of DNMT1 immunoblots normalized to β-tubulin. *Denotes statistical significance (p < 0.05), error bars are 1 SD (n = 5 confluent and growing, n = 2 starved). The Table shows the t½ ± SD of DNMT1 depletion for each experimental condition and the corresponding percentage of the cell population in s-phase.
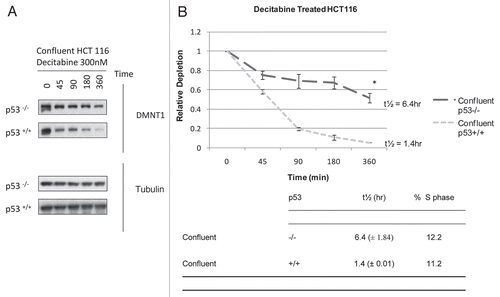
Figure 2 The p53 tumor suppressor modulates the rate of depletion of DNMT1 in HCT 116 cells exposed to decitabine. (A) Immunoblots of DNMT1 enzyme and tubulin Confluent HCT 116 cells that were wild type p53+/+ or null p53−/− were treated once with 300 nM decitabine. DNMT1 enzyme levels and β-tubulin loading control were detected by western immunoblotting. The blots are representative of five experiments for the wild type p53+/+ and two experiments for null p53−/− HCT 116 cells. (B) Time course of DNMT1 depletion by decitabine. Plots of the relative depletion of DNMT1 versus time were based on the densitometry of the DNMT1 immunoblots normalized to β-tubulin. *Denotes statistical significance, error bars are 1 SD. The table shows the t½ ± SD of DNMT1 depletion for each experimental condition and the corresponding percentage of the cell population in s-phase.

Figure 2 The p53 tumor suppressor modulates the rate of depletion of DNMT1 in HCT 116 cells exposed to decitabine. (A) Immunoblots of DNMT1 enzyme and tubulin Confluent HCT 116 cells that were wild type p53+/+ or null p53−/− were treated once with 300 nM decitabine. DNMT1 enzyme levels and β-tubulin loading control were detected by western immunoblotting. The blots are representative of five experiments for the wild type p53+/+ and two experiments for null p53−/− HCT 116 cells. (B) Time course of DNMT1 depletion by decitabine. Plots of the relative depletion of DNMT1 versus time were based on the densitometry of the DNMT1 immunoblots normalized to β-tubulin. *Denotes statistical significance, error bars are 1 SD. The table shows the t½ ± SD of DNMT1 depletion for each experimental condition and the corresponding percentage of the cell population in s-phase.

Figure 3 Epigenetic effects of decitabine in HCT 116 cells are cell cycle dependent: MAGE-A1 re-expression is s-phase dependent. Reverse transcription PCR and ethidium bromide detection of MAGE-A1 mRNA expression at 24 and 48 h after a single exposure to 300 nM decitabine in growing, confluent or confluent HCT 116 cells released from arrest. GAPDH and actin were used as procedural controls. Agarose gels shown are representative of three experiments.
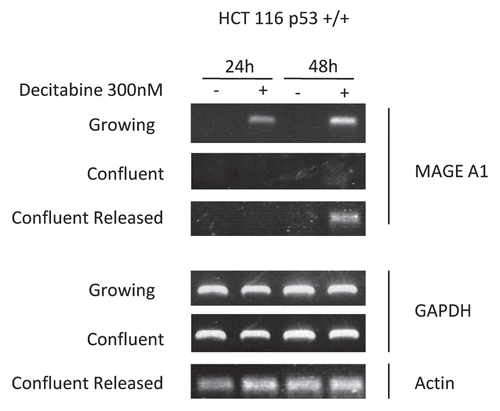
Figure 3 Epigenetic effects of decitabine in HCT 116 cells are cell cycle dependent: MAGE-A1 re-expression is s-phase dependent. Reverse transcription PCR and ethidium bromide detection of MAGE-A1 mRNA expression at 24 and 48 h after a single exposure to 300 nM decitabine in growing, confluent or confluent HCT 116 cells released from arrest. GAPDH and actin were used as procedural controls. Agarose gels shown are representative of three experiments.

Figure 4 A p53 response to DNA damage coincides with the epigenetic effects of decitabine. (A) Immunoblot of p53 tumor suppressor protein and tubulin in growing cells. Growing wild-type p53+/+ HCT116 cells were treated once with 300 nM decitabine. p53 Protein and α-tubulin loading control in cell lysates were measured at 12 h intervals by western immunoblotting. (B) Immunoblot of p53 tumor suppressor protein and tubulin in confluent cells. Confluent wild-type p53+/+ HCT116 cells were treated once with 300 nM 5decitabine. p53 Protein and β-tubulin loading control in cell lysates were measured at 12 h intervals by western immunoblotting.
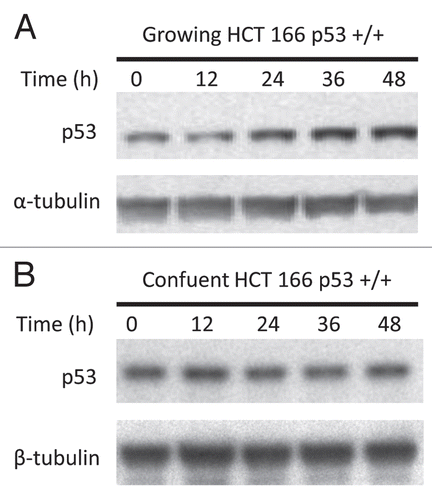
Figure 4 A p53 response to DNA damage coincides with the epigenetic effects of decitabine. (A) Immunoblot of p53 tumor suppressor protein and tubulin in growing cells. Growing wild-type p53+/+ HCT116 cells were treated once with 300 nM decitabine. p53 Protein and α-tubulin loading control in cell lysates were measured at 12 h intervals by western immunoblotting. (B) Immunoblot of p53 tumor suppressor protein and tubulin in confluent cells. Confluent wild-type p53+/+ HCT116 cells were treated once with 300 nM 5decitabine. p53 Protein and β-tubulin loading control in cell lysates were measured at 12 h intervals by western immunoblotting.

Table 1 Epigenetic effects of eecitabine are replication dependent

Supplemental material

Additional material

Download Zip (113 KB)

Reprints and Corporate Permissions

Please note: Selecting permissions does not provide access to the full text of the article, please see our help page How do I view content?

To request a reprint or corporate permissions for this article, please click on the relevant link below:

Academic Permissions

Please note: Selecting permissions does not provide access to the full text of the article, please see our help page How do I view content?

Obtain permissions instantly via Rightslink by clicking on the button below:

If you are unable to obtain permissions via Rightslink, please complete and submit this Permissions form. For more information, please visit our Permissions help page.