1,031
Views
28
CrossRef citations to date
0
Altmetric
Research Paper

The 3D tissue microenvironment modulates DNA methylation and E-cadherin expression in squamous cell carcinoma

, , , , , , & show all
Pages 34-46 | Received 20 Sep 2011, Accepted 27 Oct 2011, Published online: 01 Jan 2012

Figures & data

Figure 1. Isolation and characterization of E-cadherin expression in OSCC cell lines. (A-C) Cell lineage map of Inv-1a isolation. (A) MSCC-1harbor cells that form adhesive clusters (long arrow) and individual, spindle shaped cells (short arrow). (B) The majority of Inv-1 cells appear as individual, spindle shaped cells. (C) All Inv-1a cells are spindle shaped and appear as single cells. (D) Immunofluorescent staining of cells for E-cadherin (red) and dapi (blue). Only MSCC-1 cells show positive E-cadherin expression localized to the cell-cell junctions. Scale bars = 100 µm. (E) protein gel blot analysis of E-cadherin and GAPDH in protein extracts from MSCC-1, Inv-1, and Inv-1a. (F) qRT-PCR for E-cadherin mRNA. Data are compared with MSCC-1 and normalized to GAPDH. ***p < 0.00001.
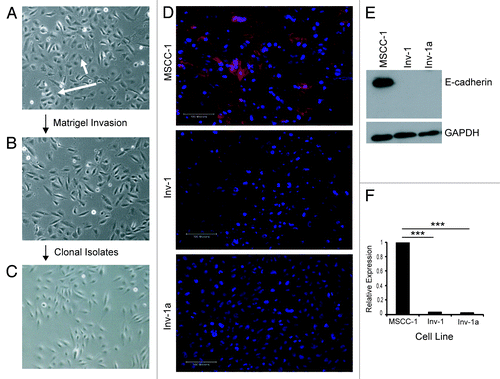
Figure 1. Isolation and characterization of E-cadherin expression in OSCC cell lines. (A-C) Cell lineage map of Inv-1a isolation. (A) MSCC-1harbor cells that form adhesive clusters (long arrow) and individual, spindle shaped cells (short arrow). (B) The majority of Inv-1 cells appear as individual, spindle shaped cells. (C) All Inv-1a cells are spindle shaped and appear as single cells. (D) Immunofluorescent staining of cells for E-cadherin (red) and dapi (blue). Only MSCC-1 cells show positive E-cadherin expression localized to the cell-cell junctions. Scale bars = 100 µm. (E) protein gel blot analysis of E-cadherin and GAPDH in protein extracts from MSCC-1, Inv-1, and Inv-1a. (F) qRT-PCR for E-cadherin mRNA. Data are compared with MSCC-1 and normalized to GAPDH. ***p < 0.00001.

Figure 2. Characterization of the method of E-cadherin suppression in the Inv-1a cell line. (A) MSP for E-cadherin promoter methylation in MSCC-1, Inv-1, and Inv-1a cells. MDA-MB435s cells were used for the positive control as they have been shown to harbor a highly methylated E-cadherin promoter while MCF7 cells were used as the negative control as they have been shown to express E-cadherin. (B) qRT-PCR for E-cadherin transcription following treatment of cells with 5-aza-CdR. (C) Immunofluorescent staining for E-cadherin (red) and dapi (blue) in Inv-1a cells following treatment with 5-aza-CdR. E-cadherin is expressed and localized to the cell-cell junctions. Scale bar = 100 µm. (D) MSP for E-cadherin promoter methylation in Inv-1a cells following treatment with 5-aza-CdR. (E) protein gel blot analysis reveals high DNMT1 protein expression in both the Inv-1 and Inv-1a cell lines compared with the MSCC-1 cell line. (F) qRT-PCR for DNMT1. Data are relative to MSCC-1 and is normalized to GAPDH. (G) qRT-PCR for DNMT1 and E-cadherin in Inv-1a cells transfected with siRNA against DNMT1. Data are normalized to GAPDH. (H) qRT-PCR for DNMT1 and E-cadherin in Inv-1a cells infected with shRNA against DNMT1. Data are normalized to GAPDH.
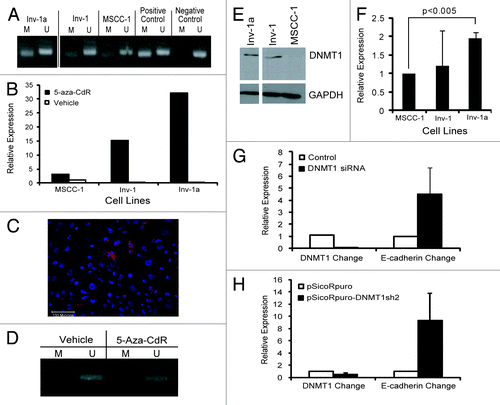
Figure 2. Characterization of the method of E-cadherin suppression in the Inv-1a cell line. (A) MSP for E-cadherin promoter methylation in MSCC-1, Inv-1, and Inv-1a cells. MDA-MB435s cells were used for the positive control as they have been shown to harbor a highly methylated E-cadherin promoter while MCF7 cells were used as the negative control as they have been shown to express E-cadherin. (B) qRT-PCR for E-cadherin transcription following treatment of cells with 5-aza-CdR. (C) Immunofluorescent staining for E-cadherin (red) and dapi (blue) in Inv-1a cells following treatment with 5-aza-CdR. E-cadherin is expressed and localized to the cell-cell junctions. Scale bar = 100 µm. (D) MSP for E-cadherin promoter methylation in Inv-1a cells following treatment with 5-aza-CdR. (E) protein gel blot analysis reveals high DNMT1 protein expression in both the Inv-1 and Inv-1a cell lines compared with the MSCC-1 cell line. (F) qRT-PCR for DNMT1. Data are relative to MSCC-1 and is normalized to GAPDH. (G) qRT-PCR for DNMT1 and E-cadherin in Inv-1a cells transfected with siRNA against DNMT1. Data are normalized to GAPDH. (H) qRT-PCR for DNMT1 and E-cadherin in Inv-1a cells infected with shRNA against DNMT1. Data are normalized to GAPDH.

Figure 3. The methylation-mediated regulation of E-cadherin expression within the Inv-1a cells is related to specific CpG methylation. (A) Schematic illustration of the CpG island within the E-cadherin promoter. Vertical lines indicate CpGs. The bent arrow indicates the transcriptional start site. The small horizontal arrows indicate the primer set used for MSP while the line indicates the region amplified for BSP analysis. (B) BSP data for Inv-1a, Inv-1, and MSCC-1 cells lines. The white circles indicate unmethylated CpGs while the black circles indicate those CpGs that are methylated. The transcriptional start site is indicated by the bent black arrow. The large rectangles indicate the 4 CpGs found to be significantly differentially methylated between Inv-1a and MSCC-1 and Inv-1 **p < 0.01 (C) Statistical analysis of the methylation of different CpGs in the Inv-1a E-cadherin promoter compared with either the Inv-1 or MSCC-1. *p < 0.1, **p < 0.01
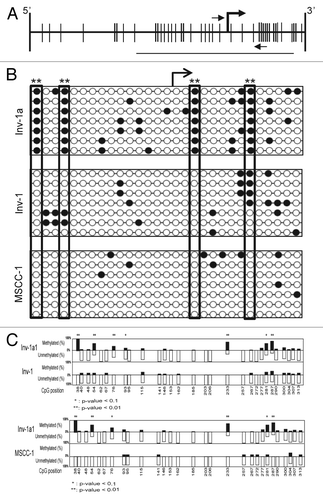
Figure 3. The methylation-mediated regulation of E-cadherin expression within the Inv-1a cells is related to specific CpG methylation. (A) Schematic illustration of the CpG island within the E-cadherin promoter. Vertical lines indicate CpGs. The bent arrow indicates the transcriptional start site. The small horizontal arrows indicate the primer set used for MSP while the line indicates the region amplified for BSP analysis. (B) BSP data for Inv-1a, Inv-1, and MSCC-1 cells lines. The white circles indicate unmethylated CpGs while the black circles indicate those CpGs that are methylated. The transcriptional start site is indicated by the bent black arrow. The large rectangles indicate the 4 CpGs found to be significantly differentially methylated between Inv-1a and MSCC-1 and Inv-1 **p < 0.01 (C) Statistical analysis of the methylation of different CpGs in the Inv-1a E-cadherin promoter compared with either the Inv-1 or MSCC-1. *p < 0.1, **p < 0.01

Figure 4. E-cadherin is re-expressed in Inv-1a cells when grown in the context of a 3D tissue. (A) Tissues generated from MSCC-1, Inv-1, and Inv-1a cell lines were stained with hematoxylin and eosin to examine the tissue architecture. The dashed black lines indicate the interface of the epithelium and the underlying stroma. Black arrows indicate the invading cells. (B) Immunohistochemical staining of 3D tissues for E-cadherin (red) and dapi (blue) reveal E-cadherin staining in all three tissue types. The E-cadherin positive Inv-1a cells are indicated by thin white arrows, while the thick white arrow indicates Inv-1a cells that have invaded into the stroma but do not express E-cadherin. (C) Immunohistochemical staining of 3D tissues for the basement membrane proteins (green) Laminin 5 and Collagen IV in relation to E-cadherin (red) and dapi (blue) in all three tissue types. Tissue made of normal human keratinocytes served as a control. E-cadherin negative Inv-1a cells in conjunction with abnormal Collagen IV staining are indicated by the white arrows. Scale bars = 100 µm.
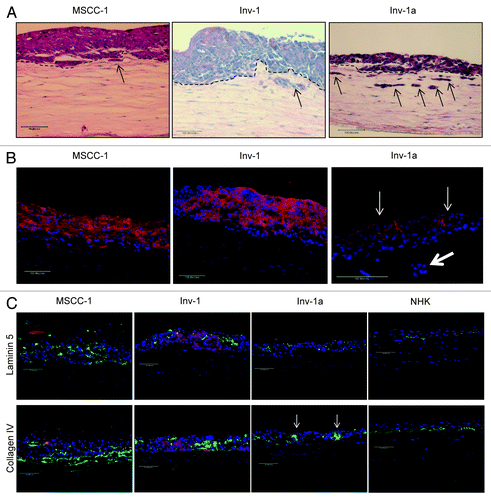
Figure 4. E-cadherin is re-expressed in Inv-1a cells when grown in the context of a 3D tissue. (A) Tissues generated from MSCC-1, Inv-1, and Inv-1a cell lines were stained with hematoxylin and eosin to examine the tissue architecture. The dashed black lines indicate the interface of the epithelium and the underlying stroma. Black arrows indicate the invading cells. (B) Immunohistochemical staining of 3D tissues for E-cadherin (red) and dapi (blue) reveal E-cadherin staining in all three tissue types. The E-cadherin positive Inv-1a cells are indicated by thin white arrows, while the thick white arrow indicates Inv-1a cells that have invaded into the stroma but do not express E-cadherin. (C) Immunohistochemical staining of 3D tissues for the basement membrane proteins (green) Laminin 5 and Collagen IV in relation to E-cadherin (red) and dapi (blue) in all three tissue types. Tissue made of normal human keratinocytes served as a control. E-cadherin negative Inv-1a cells in conjunction with abnormal Collagen IV staining are indicated by the white arrows. Scale bars = 100 µm.

Figure 5. Re-expression of E-cadherin within the Inv-1a cells results in a thickened tissue formation and a reduction in the number of invasive cells. (A) RT-PCR for E-cadherin in Inv-1a clones that were infected with an E-cadherin-expressing retroviral vector showing E-cadherin expression. (B) H&E and immunofluorescence (E-cadherin – red; dapi – blue) staining of 3D tissues composed of either E-cadherin positive or E-cadherin negative Inv-1a cells. Scale bars = 100 µm.
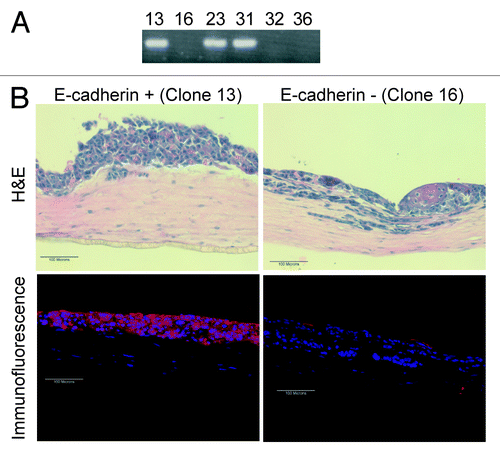
Figure 5. Re-expression of E-cadherin within the Inv-1a cells results in a thickened tissue formation and a reduction in the number of invasive cells. (A) RT-PCR for E-cadherin in Inv-1a clones that were infected with an E-cadherin-expressing retroviral vector showing E-cadherin expression. (B) H&E and immunofluorescence (E-cadherin – red; dapi – blue) staining of 3D tissues composed of either E-cadherin positive or E-cadherin negative Inv-1a cells. Scale bars = 100 µm.

Figure 6. Gain of E-cadherin expression in the Inv-1a tissues is due to loss of DNA methylation, increased stromal invasion and elevated DNMT1 expression. (A) E-cadherin staining in a paraffin section of Inv-1a tissue used for LCM. The black arrow indicates the E-cadherin positive cells that were removed for DNA isolation. (B) MSP analysis of the DNA isolated from microdissected E-cadherin negative and positive cells in the Inv-1a tissue. Inv-1a cells grown in 2D culture were used as a control. (C) Immunohistochemical staining of E-cadherin (red) and DNMT1 (green) in 3D tissues composed of Inv-1a cell. The white boxes indicate regions of the tissue that stain for E-cadherin but have low levels of DNMT1 expression. Scale bars = 100 µm.
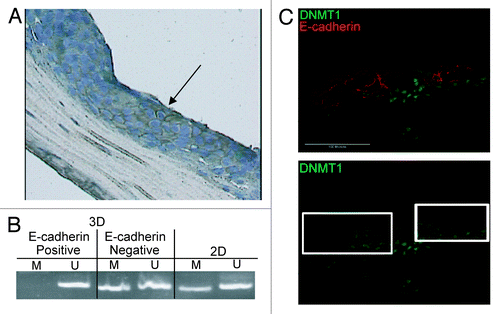
Figure 6. Gain of E-cadherin expression in the Inv-1a tissues is due to loss of DNA methylation, increased stromal invasion and elevated DNMT1 expression. (A) E-cadherin staining in a paraffin section of Inv-1a tissue used for LCM. The black arrow indicates the E-cadherin positive cells that were removed for DNA isolation. (B) MSP analysis of the DNA isolated from microdissected E-cadherin negative and positive cells in the Inv-1a tissue. Inv-1a cells grown in 2D culture were used as a control. (C) Immunohistochemical staining of E-cadherin (red) and DNMT1 (green) in 3D tissues composed of Inv-1a cell. The white boxes indicate regions of the tissue that stain for E-cadherin but have low levels of DNMT1 expression. Scale bars = 100 µm.

Figure 7. Specific histone modifications provide evidence for the plasticity of E-cadherin epigenetic regulation. (A) qRT-PCR for E-cadherin in Inv-1a cells after treatment with 5-aza-CdR, TSA, or the combination of the two (Combo). Data are normalized to GAPDH. **p < 0.03, ***p < 0.009 (B) ChIP analysis of methylated histones H3K4, H3K9, and H3K27 in association with the E-cadherin promoter in MSCC-1, Inv-1, and Inv-1a cells. No association of the E-cadherin promoter with methylated H3K9 was detected in any cell line.
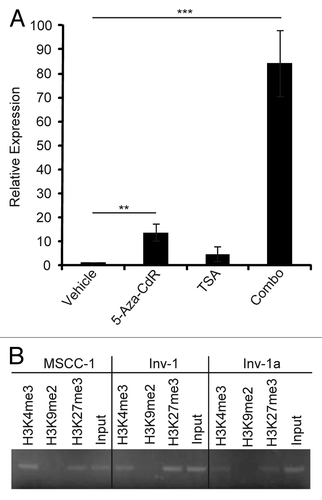
Figure 7. Specific histone modifications provide evidence for the plasticity of E-cadherin epigenetic regulation. (A) qRT-PCR for E-cadherin in Inv-1a cells after treatment with 5-aza-CdR, TSA, or the combination of the two (Combo). Data are normalized to GAPDH. **p < 0.03, ***p < 0.009 (B) ChIP analysis of methylated histones H3K4, H3K9, and H3K27 in association with the E-cadherin promoter in MSCC-1, Inv-1, and Inv-1a cells. No association of the E-cadherin promoter with methylated H3K9 was detected in any cell line.

Figure 8. Putative DNMT1 binding miR-148a affects DNMT1 and E-cadherin expression levels. (A) qPCR for miRNAs likely to bind to DNMT1. All data are normalized to U6 expression. ***p < 0.0001. (B) qPCR analysis of miR-148a expression after Inv-1a infection with either empty vector (pBabe) or the retroviral construct coding for miR-148a. (C) qPCR analysis of the mRNA levels of DNMT1 and E-cadherin in Inv-1a cells infected with either the empty pBabe vector or the vector encoding miR-148a. ***p < 0.02.
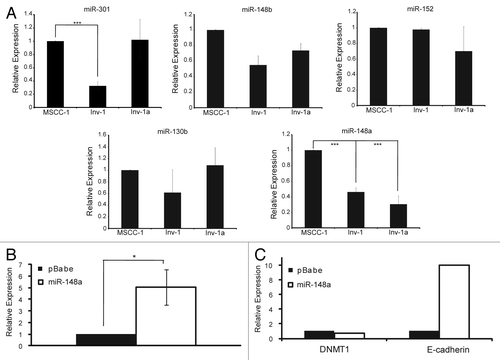
Figure 8. Putative DNMT1 binding miR-148a affects DNMT1 and E-cadherin expression levels. (A) qPCR for miRNAs likely to bind to DNMT1. All data are normalized to U6 expression. ***p < 0.0001. (B) qPCR analysis of miR-148a expression after Inv-1a infection with either empty vector (pBabe) or the retroviral construct coding for miR-148a. (C) qPCR analysis of the mRNA levels of DNMT1 and E-cadherin in Inv-1a cells infected with either the empty pBabe vector or the vector encoding miR-148a. ***p < 0.02.

Table 1. A listing of all primers used in qPCR, MSP, BSP, and ChIP

Reprints and Corporate Permissions

Please note: Selecting permissions does not provide access to the full text of the article, please see our help page How do I view content?

To request a reprint or corporate permissions for this article, please click on the relevant link below:

Academic Permissions

Please note: Selecting permissions does not provide access to the full text of the article, please see our help page How do I view content?

Obtain permissions instantly via Rightslink by clicking on the button below:

If you are unable to obtain permissions via Rightslink, please complete and submit this Permissions form. For more information, please visit our Permissions help page.