Figures & data
Figure 1. Schematic representation of the analysis pipeline.
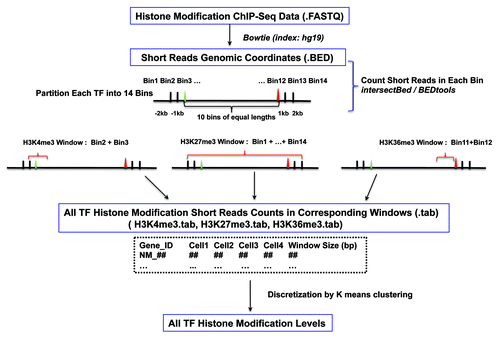
Figure 2. HPTFs are characterized by increased histone modification variations during blood cell differentiation. The radar plot has 4 poles, each corresponding to a level of histone modification variation. Level of variation is designated as “none,” “low,” “medium” and “high.” On each of the 4 axes, the percentage of TFs with a corresponding histone modification variation level is noted. For a given histone mark, points representing the variation levels on the 4 axes are connected sequentially. Different histone marks are illustrated by different colors. Dashed lines depict the variations of other TFs (apart from HPTFs), and solid lines depict the variations of HPTFs.
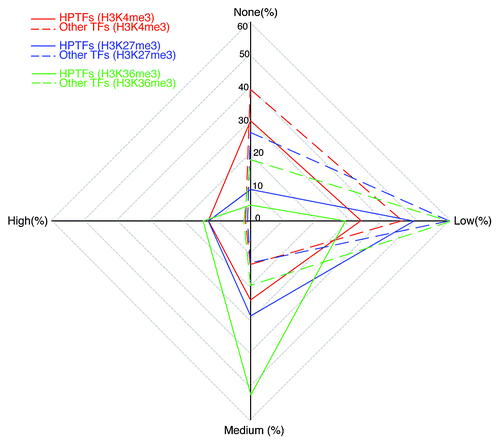
Figure 3. Hierarchical clustering of all TFs based on the variation scores of three histone marks. The tree was cut into 5 groups, each encompassing a variable number of TFs. The order of the groups (A to E) was based on the group size.
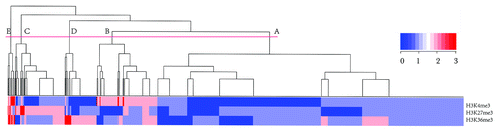
Table 1. Features of the Five Subclasses of TFs and Overlap with HPTFs
Table 2. Potential HPTFs in Group E
Figure 4. Two potential HPTFs within group E show blood cell-specific expression patterns. A total of 84 human cell lines or primary tissues were characterized by expression profiling. Tissues or cell lines, denoted by numbers with black colors, represent a broad range of non-blood tissues (or cell lines), such as kidney, thymus, liver, lung, prostate, heart and others. Red numbers 28–37 denote MOLT-4, K562, lymphoma, HL‑60, Raji and early erythroid cells. Red numbers 74 to 84 denote CD34+ cells, B lymphoblasts, CD19+ B cells, dendritic cells, CD8+ T cells, CD4+ T cells, CD56+ NK cells, CD33+ myeloid cells, CD14+ monocytes and whole blood. The expression profiles for MSC and RUNX3 were obtained from Biogps (biogps.org).
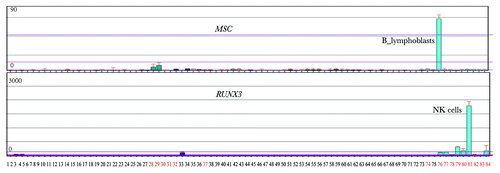
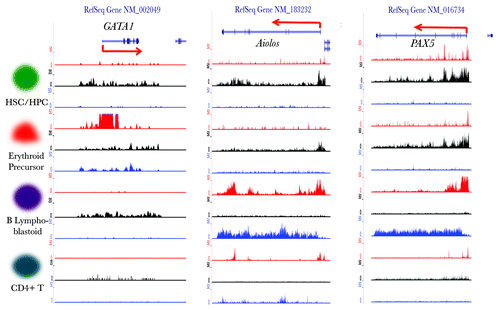
Figure 5. Visualization of the histone modification dynamics of some HPTFs. From left to right, the histone modification profiles are displayed for the genomic loci of HPTFs GATA1, Aiolos and PAX5 in CD133+ cells (HSCs/ HPCs), CD36+ cells (erythrocyte precursors), GM12878 cells (B lymphoblastoids) and CD4+ T cells. The histone modification ChIP‑seq tag wiggle files were uploaded to the UCSC genome browser and visualized as custom tracks. The panels in red, black and blue denote the profiles of H3K4me3, H3K27me3 and H3K36me3, respectively. The structures of genes are shown at the top panels.