1,762
Views
86
CrossRef citations to date
0
Altmetric
Research Paper

Role of DNA methylation in the regulation of the RANKL-OPG system in human bone

, , , , &
Pages 83-91 | Received 14 Sep 2011, Accepted 13 Nov 2011, Published online: 01 Jan 2012

Figures & data

Figure 1. Locations of the RANKL and OPG CpG islands, qMSP and pyrosequencing amplicons. (A) Non-scaled representation of the RANKL gene. Two CpG-rich regions were identified, the upstream one located at -14415 bp from the TSS of the isoform I; and the downstream one, located -260 bp from isoform I TSS. One qMSP amplicon was designed for each region (white arrows). A pyrosequencing amplicon was designed for the downstream CpG region (black arrows). MSP was performed with control fully methylated DNA (DNA-M) or completely unmethylated (DNA-U) to verify the specificity of the MSP primers. (B) Non-scaled representation of the OPG gene. One CpG island was found spanning from -402 to +850 bp of the TSS. qMSP and pyrosequencing amplicons were designed within the CpG-rich area (white and black arrows respectively). MSP was performed using DNA-M or DNA-U to verify the specificity of the MSP primers.
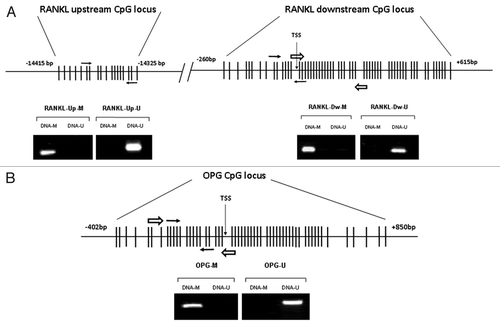
Figure 1. Locations of the RANKL and OPG CpG islands, qMSP and pyrosequencing amplicons. (A) Non-scaled representation of the RANKL gene. Two CpG-rich regions were identified, the upstream one located at -14415 bp from the TSS of the isoform I; and the downstream one, located -260 bp from isoform I TSS. One qMSP amplicon was designed for each region (white arrows). A pyrosequencing amplicon was designed for the downstream CpG region (black arrows). MSP was performed with control fully methylated DNA (DNA-M) or completely unmethylated (DNA-U) to verify the specificity of the MSP primers. (B) Non-scaled representation of the OPG gene. One CpG island was found spanning from -402 to +850 bp of the TSS. qMSP and pyrosequencing amplicons were designed within the CpG-rich area (white and black arrows respectively). MSP was performed using DNA-M or DNA-U to verify the specificity of the MSP primers.

Figure 2.RANKL expression and methylation analysis in cell lines and primary osteoblasts. (A) The abundance of RANKL transcripts was determined by RT-qPCR. Results are expressed as relative expression to the housekeeping gene TBP. Methylation of the downstream CpG region was studied by pyrosequencing. Bars represent average % methylation of the CpG dinucleotides studied. Mean and SD of three independent experiments for each cell line is represented. (B) Methylation was explored in the upstream (CpGs 5, 6 and 7 in the forward primer; CpGs 17 and 18 in the reverse primer) and downstream CpG islands (CpGs 9 and 10 in the forward primer; 15 and 16 in the reverse primer) by qMSP. Mean and SD of three independent experiments is showed. (C) All individual CpGs studied (CpGs 15 to 23) by pyrosequencing of the RANKL downstream island showed a similar methylation status. Black slices represent the percentage of methylation. Note that only CpG 1 to 40 are displayed in figure C.
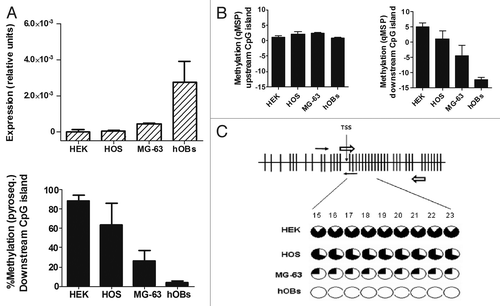
Figure 2.RANKL expression and methylation analysis in cell lines and primary osteoblasts. (A) The abundance of RANKL transcripts was determined by RT-qPCR. Results are expressed as relative expression to the housekeeping gene TBP. Methylation of the downstream CpG region was studied by pyrosequencing. Bars represent average % methylation of the CpG dinucleotides studied. Mean and SD of three independent experiments for each cell line is represented. (B) Methylation was explored in the upstream (CpGs 5, 6 and 7 in the forward primer; CpGs 17 and 18 in the reverse primer) and downstream CpG islands (CpGs 9 and 10 in the forward primer; 15 and 16 in the reverse primer) by qMSP. Mean and SD of three independent experiments is showed. (C) All individual CpGs studied (CpGs 15 to 23) by pyrosequencing of the RANKL downstream island showed a similar methylation status. Black slices represent the percentage of methylation. Note that only CpG 1 to 40 are displayed in figure C.

Figure 3.OPG expression and methylation analysis in culture cell lines and primary osteoblasts. (A) OPG expression was detected by RT-qPCR. Results are expressed as relative expression in relation to the housekeeping gene TBP. Methylation was studied by qMSP (CpGs 10, 11 and 12 in the forward primer; CpGs 18, 19 and 20 in the reverse primer). For pyrosequencing bars represent the average % methylation of the CpG dinucleotides studied. Mean and SD of three independent experiments for each cell line is presented. (B) The CpG sites studied by pyrosequencing (CpGs 10–12) showed a similar degree of methylation. Each circle represents one CpG site. The black slices represent the percentage of methylation. Note that only CpGs 1 to 33 are displayed in figure B.
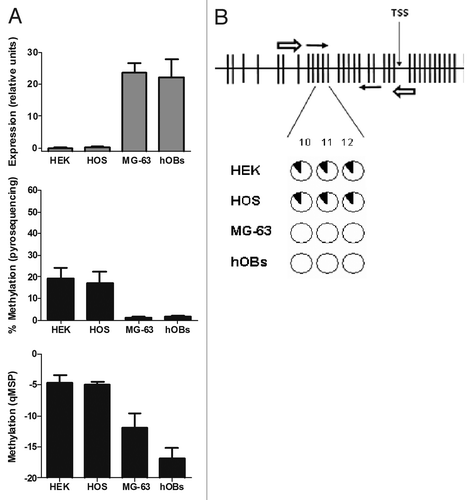
Figure 3.OPG expression and methylation analysis in culture cell lines and primary osteoblasts. (A) OPG expression was detected by RT-qPCR. Results are expressed as relative expression in relation to the housekeeping gene TBP. Methylation was studied by qMSP (CpGs 10, 11 and 12 in the forward primer; CpGs 18, 19 and 20 in the reverse primer). For pyrosequencing bars represent the average % methylation of the CpG dinucleotides studied. Mean and SD of three independent experiments for each cell line is presented. (B) The CpG sites studied by pyrosequencing (CpGs 10–12) showed a similar degree of methylation. Each circle represents one CpG site. The black slices represent the percentage of methylation. Note that only CpGs 1 to 33 are displayed in figure B.

Figure 4. Effect of AzadC on RANKL and OPG expression in HEK-293 cells and primary osteoblasts. (A) RANKL expression was explored by RT-qPCR in HEK-293 cells, either untreated or treated with AzadC 5μM for 4 d. Graph shows RANKL expression relative to the housekeeping gene TBP. AzadC effect on DNA methylation of the RANKL downstream CpG region was studied by pyrosequencing and qMSP. (B) OPG transcriptional levels were explored by RT-qPCR in HEK-293 cells, either untreated or treated with AzadC 5uM for 4 d. Graph shows OPG expression relative to the housekeeping TBP. DNA methylation was explored by pyrosequencing and qMSP. (C) RANKL and OPG expression was assayed in primary osteoblasts treated with 5 μM of AzadC for 4 d (upper plot). Osteocalcin expression (BGLAP) was studied in HEK-293, either untreated or treated with AzadC 5μM for 4 d (lower plot). Graphs show OPG, RANKL and BGLAP expression relative to TBP. Mean and SD of three independent experiments for each cell line is showed.
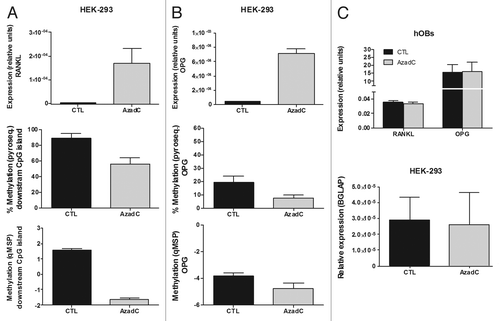
Figure 4. Effect of AzadC on RANKL and OPG expression in HEK-293 cells and primary osteoblasts. (A) RANKL expression was explored by RT-qPCR in HEK-293 cells, either untreated or treated with AzadC 5μM for 4 d. Graph shows RANKL expression relative to the housekeeping gene TBP. AzadC effect on DNA methylation of the RANKL downstream CpG region was studied by pyrosequencing and qMSP. (B) OPG transcriptional levels were explored by RT-qPCR in HEK-293 cells, either untreated or treated with AzadC 5uM for 4 d. Graph shows OPG expression relative to the housekeeping TBP. DNA methylation was explored by pyrosequencing and qMSP. (C) RANKL and OPG expression was assayed in primary osteoblasts treated with 5 μM of AzadC for 4 d (upper plot). Osteocalcin expression (BGLAP) was studied in HEK-293, either untreated or treated with AzadC 5μM for 4 d (lower plot). Graphs show OPG, RANKL and BGLAP expression relative to TBP. Mean and SD of three independent experiments for each cell line is showed.

Figure 5. Expression and methylation of RANKL and OPG genes in bone tissue from osteoporotic (OP) and osteoarthritic (OA) patients. (A) RANKL expression was studied in bone tissue samples. Bars represent RANKL expression relative to TBP. DNA methylation in the downstream CpG island was studied by pyrosequencing and qMSP, whereas methylation in the upstream region was studied by qMSP. (B) OPG studies were performed in the same samples. (C) RANKL:OPG transcript ratio. Each bar represents mean and SE values for each group.
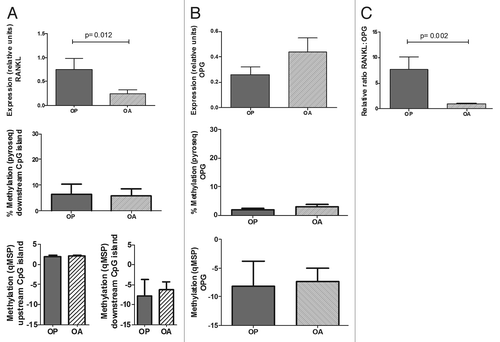
Figure 5. Expression and methylation of RANKL and OPG genes in bone tissue from osteoporotic (OP) and osteoarthritic (OA) patients. (A) RANKL expression was studied in bone tissue samples. Bars represent RANKL expression relative to TBP. DNA methylation in the downstream CpG island was studied by pyrosequencing and qMSP, whereas methylation in the upstream region was studied by qMSP. (B) OPG studies were performed in the same samples. (C) RANKL:OPG transcript ratio. Each bar represents mean and SE values for each group.

Table 1. Primer sequences and amplicon sizes for the quantitative methylation-specific PCR (qMSP) of the RANKL and OPG gene. Abreviations: bp, base pairs; Fwd, forward; Rev, reverse

Supplemental material

Additional material

Download Zip (73.6 KB)

Reprints and Corporate Permissions

Please note: Selecting permissions does not provide access to the full text of the article, please see our help page How do I view content?

To request a reprint or corporate permissions for this article, please click on the relevant link below:

Academic Permissions

Please note: Selecting permissions does not provide access to the full text of the article, please see our help page How do I view content?

Obtain permissions instantly via Rightslink by clicking on the button below:

If you are unable to obtain permissions via Rightslink, please complete and submit this Permissions form. For more information, please visit our Permissions help page.