1,482
Views
30
CrossRef citations to date
0
Altmetric
Research Paper

Sensitive quantitative analysis of murine LINE1 DNA methylation using high resolution melt analysis

, , , , &
Pages 92-105 | Received 23 Sep 2011, Accepted 21 Nov 2011, Published online: 01 Jan 2012

Figures & data

Figure 1. Detection of differences in L1 methylation. Melt curve analysis following amplification with the unbiased L1 primers (F_unbiased_mLINE1 and R_unbiased_mLINE1) - (A) the HRM normalized melt curve and (B) the first derivative melt curve (dF/dT), was performed on methylated (red) and unmethylated (green) control DNA as well as a 50% (methylated: unmethylated control) methylated sample (blue).
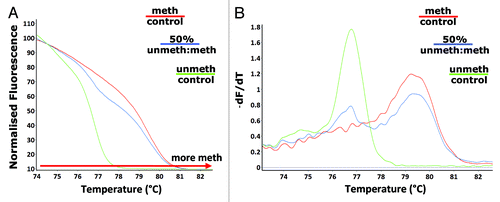
Figure 1. Detection of differences in L1 methylation. Melt curve analysis following amplification with the unbiased L1 primers (F_unbiased_mLINE1 and R_unbiased_mLINE1) - (A) the HRM normalized melt curve and (B) the first derivative melt curve (dF/dT), was performed on methylated (red) and unmethylated (green) control DNA as well as a 50% (methylated: unmethylated control) methylated sample (blue).

Figure 2. Detection of 5-aza induced partial demethylation. Vehicle control (DMSO) (blue), 0.125 µM (purple) and 0.5 µM (orange) 5-aza treated A11 cell line genomic DNA was amplified following bisulphite modification with the unbiased L1 primers and subjected along with the methylated (red) and unmethylated (green) controls to melt analysis - (A) the normalized HRM melt curve (n = 3 samples per treatment group is displayed). The samples were then amplified with unmethylated-biased primers. Melt analysis was performed on the PCR products – (B) the normalized HRM curve and (C) the difference graph (one PCR replicate for each of the n = 4–5 samples is displayed); inset is the difference graph with the unmethylated control included.
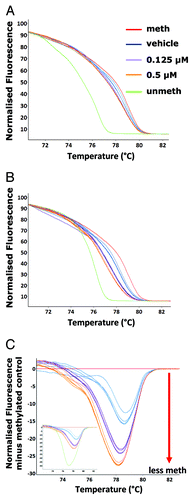
Figure 2. Detection of 5-aza induced partial demethylation. Vehicle control (DMSO) (blue), 0.125 µM (purple) and 0.5 µM (orange) 5-aza treated A11 cell line genomic DNA was amplified following bisulphite modification with the unbiased L1 primers and subjected along with the methylated (red) and unmethylated (green) controls to melt analysis - (A) the normalized HRM melt curve (n = 3 samples per treatment group is displayed). The samples were then amplified with unmethylated-biased primers. Melt analysis was performed on the PCR products – (B) the normalized HRM curve and (C) the difference graph (one PCR replicate for each of the n = 4–5 samples is displayed); inset is the difference graph with the unmethylated control included.

Figure 3. Quantitation of methylation differences using the Net Temperature Shift. The normalized fluorescence at each temperature point on the melt curve were used to calculate the mean NTS of the 5-aza treated samples for (A) L1, (B) murine B1 family Mm (B1_Mm) and (C) Intracisternal-Particle A Long-terminal Repeat (IAP_LTR) repeat elements (n = 4–5 samples per treatment group) (*p < 10−5 compared with the vehicle control; + p < 0.05 compared with the 0.125 µM treated 5-aza samples).
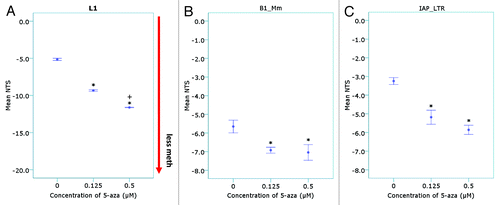
Figure 3. Quantitation of methylation differences using the Net Temperature Shift. The normalized fluorescence at each temperature point on the melt curve were used to calculate the mean NTS of the 5-aza treated samples for (A) L1, (B) murine B1 family Mm (B1_Mm) and (C) Intracisternal-Particle A Long-terminal Repeat (IAP_LTR) repeat elements (n = 4–5 samples per treatment group) (*p < 10−5 compared with the vehicle control; + p < 0.05 compared with the 0.125 µM treated 5-aza samples).

Table 2. Frequency of detected variants in L1 target sequence

Figure 4. Confirmation of the detection of 5-aza induced demethylation by the L1-assay. (A) The L1 sequence as confirmed by DNA sequencing. The location of sequence variants in the target L1 region (boxed region) in unmodified genomic DNA identified from both sequence analysis of L1-PCR products (amplified with F_unmod_mLINE1 and R_unmod_mLINE1) and in silico PCR analysis (see ) are shown in bold, numbered 1–10 in blue and characterized as an R (A/G), K (T/G) or M (A/C). CpGs are shaded and numbered in black 1–13. The L1-HRM PCR products (n = 4–5 samples per treatment group from n = 1 bisulphite modification and PCR reaction) were then subjected to pyrosequencing. The pyrosequencing primer is highlighted by the green arrow and the region pyrosequenced is shown in green. (B) The percent methylation of each CpG was plotted and separated by 5-aza concentration (vehicle - blue, 0.125 µM - purple and 0.5 µM -orange) or control DNA status (red – methylated control, green – unmethylated control). (C) The mean methylation of all CpGs pyrosequenced (7–12) was plotted vs. 5-aza concentration (*p < 10−5 compared with the vehicle control; + p < 0.05 compared with the 0.125 µM treated 5-aza samples). (D) Genomic DNA samples (n = 4–5 per treatment group) were subjected to Liquid Chromatography – Mass Spectrometry (LC-MS) and mean percent methylation (5-mdC/dG ratio) for each treatment group plotted (*p < 0.05). (E) Linear regression analysis was performed on the mean NTS for samples of a standard curve (R2 = 0.992; p < 0.001). The standard curve was made from mixtures of the vehicle and 0.5 µM 5-aza treated A11 samples (75.6, 75.45, 75.3, 75, 74.09, 72.58, 69.56, 66.54, 63.52, 60.5 and 45.4% methylated) using the mean pyrosequencing values for the two samples. The unmethylated control DNA (~3% methylated) was also included in the L1-HRM PCR reactions. The samples underwent two separate bisulphite modifications and were amplified with the unmethylated-biased primers in two separate PCR reactions per bisulphite modification, prior to melt analysis.
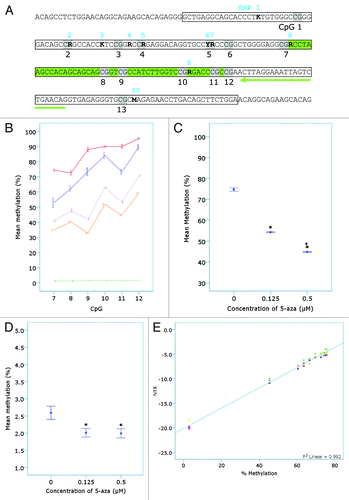
Figure 4. Confirmation of the detection of 5-aza induced demethylation by the L1-assay. (A) The L1 sequence as confirmed by DNA sequencing. The location of sequence variants in the target L1 region (boxed region) in unmodified genomic DNA identified from both sequence analysis of L1-PCR products (amplified with F_unmod_mLINE1 and R_unmod_mLINE1) and in silico PCR analysis (see Table 2) are shown in bold, numbered 1–10 in blue and characterized as an R (A/G), K (T/G) or M (A/C). CpGs are shaded and numbered in black 1–13. The L1-HRM PCR products (n = 4–5 samples per treatment group from n = 1 bisulphite modification and PCR reaction) were then subjected to pyrosequencing. The pyrosequencing primer is highlighted by the green arrow and the region pyrosequenced is shown in green. (B) The percent methylation of each CpG was plotted and separated by 5-aza concentration (vehicle - blue, 0.125 µM - purple and 0.5 µM -orange) or control DNA status (red – methylated control, green – unmethylated control). (C) The mean methylation of all CpGs pyrosequenced (7–12) was plotted vs. 5-aza concentration (*p < 10−5 compared with the vehicle control; + p < 0.05 compared with the 0.125 µM treated 5-aza samples). (D) Genomic DNA samples (n = 4–5 per treatment group) were subjected to Liquid Chromatography – Mass Spectrometry (LC-MS) and mean percent methylation (5-mdC/dG ratio) for each treatment group plotted (*p < 0.05). (E) Linear regression analysis was performed on the mean NTS for samples of a standard curve (R2 = 0.992; p < 0.001). The standard curve was made from mixtures of the vehicle and 0.5 µM 5-aza treated A11 samples (75.6, 75.45, 75.3, 75, 74.09, 72.58, 69.56, 66.54, 63.52, 60.5 and 45.4% methylated) using the mean pyrosequencing values for the two samples. The unmethylated control DNA (~3% methylated) was also included in the L1-HRM PCR reactions. The samples underwent two separate bisulphite modifications and were amplified with the unmethylated-biased primers in two separate PCR reactions per bisulphite modification, prior to melt analysis.

Table 3. Correlation of HRM assay with pyrosequencing and LC-MS

Table 4. L1-HRM inter- and intra-assay variation

Figure 5. Detection of tissue and sex specific methylation levels in murine tissues. (A) The mean NTS of L1 elements was used to assess DNA methylation levels in the kidney, liver, peripheral blood (PB), prostate and spleen tissues of male (n = 5) and female (n = 5) Balb/c and CBA mice following bisulphite modification and amplification with the unmethylated-biased primers. (B) The mean NTS of the kidney, liver, PB, prostate and spleen of male Balb/c mice when amplified with the unbiased primers for comparison with the unmethylated-biased primers.
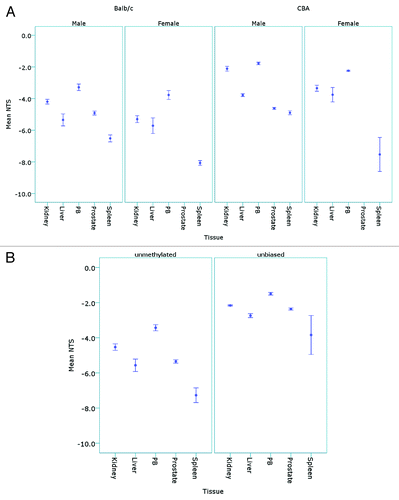
Figure 5. Detection of tissue and sex specific methylation levels in murine tissues. (A) The mean NTS of L1 elements was used to assess DNA methylation levels in the kidney, liver, peripheral blood (PB), prostate and spleen tissues of male (n = 5) and female (n = 5) Balb/c and CBA mice following bisulphite modification and amplification with the unmethylated-biased primers. (B) The mean NTS of the kidney, liver, PB, prostate and spleen of male Balb/c mice when amplified with the unbiased primers for comparison with the unmethylated-biased primers.

Table 1. Primer sequences

Supplemental material

Additional material

Download Zip (137.1 KB)

Reprints and Corporate Permissions

Please note: Selecting permissions does not provide access to the full text of the article, please see our help page How do I view content?

To request a reprint or corporate permissions for this article, please click on the relevant link below:

Academic Permissions

Please note: Selecting permissions does not provide access to the full text of the article, please see our help page How do I view content?

Obtain permissions instantly via Rightslink by clicking on the button below:

If you are unable to obtain permissions via Rightslink, please complete and submit this Permissions form. For more information, please visit our Permissions help page.