Figures & data
Table 1. Abundance of specimens (Genus/species), by order and family, sampled in the plant canopy of genetically modified (GM) and non-genetically modified common bean plants (NGM) by year (2004, 2005 and 2006) and respective trophic guilds
Table 2. Mean number of the most frequent species sampled in plant canopy of genetically modified (GM) and non-genetically modified common bean plants (NGM) in the three-year experiment
Table 3. Stepwise selection summary for the ordination procedure to select arthropod species that would be included in the canonical variate analysis for maximum discrimination between treatments
Table 4. Impact of the main treatments on arthropod assemblages in three years of experiments
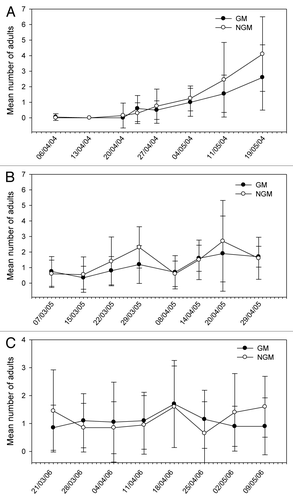
Figure 1. Mean number of adults of Cerotoma arcuata sampled in plant canopy of genetically modified (GM) and non-genetically modified common bean plants (NGM), in 2 m of row, in eight sampling dates in 2004 (A), 2005 (B), and 2006 (C). Asterisk in the specific sample date indicates that treatments are significantly different (Tukey’s test of transformed data using ; P < 0.05).
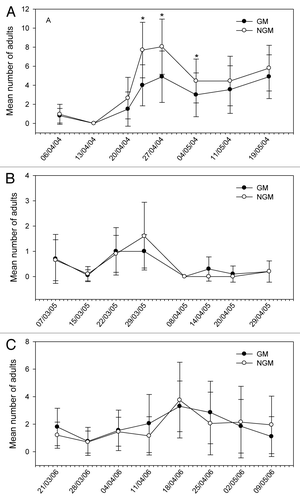
Figure 2. Mean number of adults of Bemisia tabacisampled in plant canopy of genetically modified (GM) and non-genetically modified common bean plants (NGM), in 2 m of row, in eight sampling dates in 2004 (A), 2005 (B), and 2006 (C). Asterisk in the specific sample date indicates that treatments are significantly different (Tukey’s test of transformed data using ; P < 0.05).
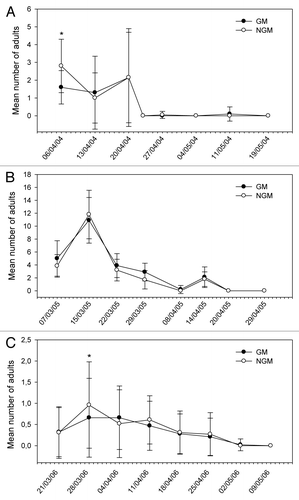
Figure 3. Mean number of nymphs and adults of Pentatomidae sampled in plant canopy of genetically modified (GM) and non-genetically modified common bean plants (NGM), in 2 m of row, in eight sampling dates in 2004 (A), 2005 (B), and 2006 (C). Asterisk in the specific sample date indicates that treatments are significantly different (Tukey’s test of transformed data using ; P < 0.05).
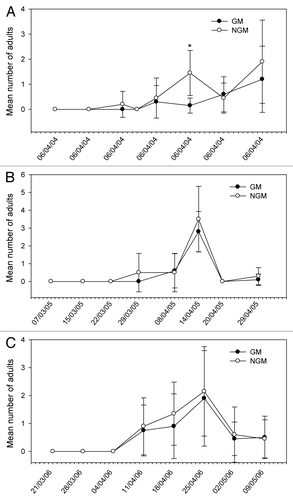
Figure 4. Mean number of nymphs and adults of Emposca kraemeri sampled in plant canopy of genetically modified (GM) and non-genetically modified common bean plants (NGM), in 2 m of row, in eight sampling dates in 2004 (A), 2005 (B), and 2006 (C). Asterisk in the specific sample date indicates that treatments are significantly different (Tukey’s test of transformed data using ; P < 0.05).
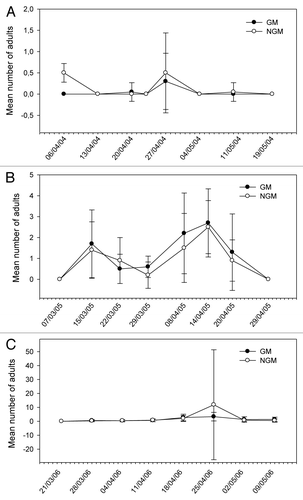
Figure 5. Mean number of adults of Diabrotica speciosa sampled in plant canopy of genetically modified (GM) and non-genetically modified common bean plants (NGM), in 2 m of row, in eight sampling dates in 2004 (A), 2005 (B), and 2006 (C). Asterisk in the specific sample date indicates that treatments are significantly different (Tukey’s test of transformed data using ; P < 0.05).