1,942
Views
38
CrossRef citations to date
0
Altmetric
Research Paper

Crohn disease-associated Escherichia coli promote gastrointestinal inflammatory disorders by activation of HIF-dependent responses

, , , , &
Pages 335-346 | Published online: 01 Nov 2011

Figures & data

Figure 1. HIF-1α staining in intestinal biopsies of CD patients and healthy subjects. (A) Immunohistochemical (IHC) staining of tissues micro-array (TMA) from ileal and colonic biopsies of patients in acute inflamed and quiescent phase of CD. Each picture is representative of immunostaining for HIF-1α at low magnification (scale bar = 100 µm) and at high original magnification scale bar = 30 µm). IHC shows numerous HIF-1α-stained nuclei, from the bottom of the crypts to the apical surface of villi, in the epithelia of the ileum and colon of CD-patients. (B) Quantification using the Spot Browser software of HIF-1α immunostaining on TMA from colonic and ileal biopsies of 85 patients in the acute phase of CD, 95 patients in the quiescent phase of CD, and 48 control subjects *p < 0.01, **p < 0.001 CD patients vs. healthy subjects; # p < 0.01, ileum of acute inflamed phase vs. quiescent phase of CD patients. TMA quantification shows that HIF-1α positive cell density was increased in ileum and colon of CD-patients vs. control healthy individuals.
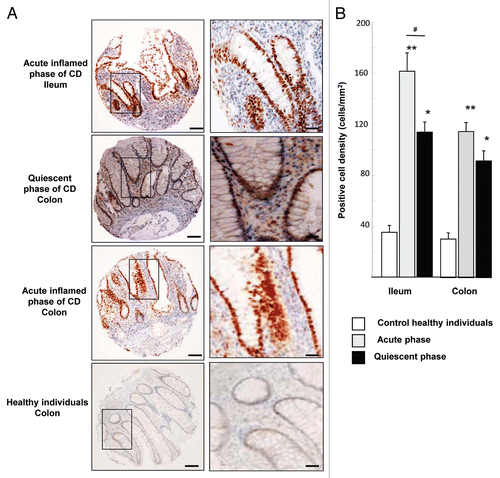
Figure 1. HIF-1α staining in intestinal biopsies of CD patients and healthy subjects. (A) Immunohistochemical (IHC) staining of tissues micro-array (TMA) from ileal and colonic biopsies of patients in acute inflamed and quiescent phase of CD. Each picture is representative of immunostaining for HIF-1α at low magnification (scale bar = 100 µm) and at high original magnification scale bar = 30 µm). IHC shows numerous HIF-1α-stained nuclei, from the bottom of the crypts to the apical surface of villi, in the epithelia of the ileum and colon of CD-patients. (B) Quantification using the Spot Browser software of HIF-1α immunostaining on TMA from colonic and ileal biopsies of 85 patients in the acute phase of CD, 95 patients in the quiescent phase of CD, and 48 control subjects *p < 0.01, **p < 0.001 CD patients vs. healthy subjects; # p < 0.01, ileum of acute inflamed phase vs. quiescent phase of CD patients. TMA quantification shows that HIF-1α positive cell density was increased in ileum and colon of CD-patients vs. control healthy individuals.

Figure 2. AIEC LF82 bacteria increase HIF-1α expression in CEABAC 10 transgenic mice. (A) Quantification of the HIF-1α mRNA level was measured by RT-PCR in colonic biopsies of WT and CEABAC 10 mice non-infected (NI) or infected with AIEC LF82 or non-pathogenic E. coli K12 bacteria. HIF-1α mRNA level is only increased in colonic biopsies of CEABAC 10 mice infected with LF82 bacteria. Results shown are representative of two separate experiments (n = 7 mice per group). (B) Representative brown immunohistochemical staining for HIF-1α in sections of the colonic mucosa from WT or CEABAC 10 mice non-infected or infected with the non-pathogenic E. coli K12 or AIEC LF82 bacteria (scale bar = 20 µm). Inset in panel CEABAC 10 NI shows the absence of staining when biopsy is stained with control isotypic antibody. Inset in CEABAC 10 K12 panel shows HIF-1α cytoplasmic staining in mature enterocytes. Inset in CEABAC 10 LF82 panel highlights the HIF-1α nuclear staining within epithelial cells located along the crypts. *, muscularis mucosa
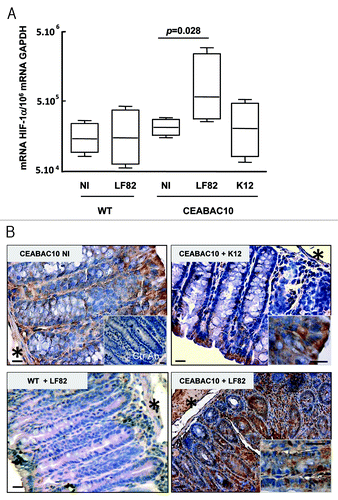
Figure 2. AIEC LF82 bacteria increase HIF-1α expression in CEABAC 10 transgenic mice. (A) Quantification of the HIF-1α mRNA level was measured by RT-PCR in colonic biopsies of WT and CEABAC 10 mice non-infected (NI) or infected with AIEC LF82 or non-pathogenic E. coli K12 bacteria. HIF-1α mRNA level is only increased in colonic biopsies of CEABAC 10 mice infected with LF82 bacteria. Results shown are representative of two separate experiments (n = 7 mice per group). (B) Representative brown immunohistochemical staining for HIF-1α in sections of the colonic mucosa from WT or CEABAC 10 mice non-infected or infected with the non-pathogenic E. coli K12 or AIEC LF82 bacteria (scale bar = 20 µm). Inset in panel CEABAC 10 NI shows the absence of staining when biopsy is stained with control isotypic antibody. Inset in CEABAC 10 K12 panel shows HIF-1α cytoplasmic staining in mature enterocytes. Inset in CEABAC 10 LF82 panel highlights the HIF-1α nuclear staining within epithelial cells located along the crypts. *, muscularis mucosa

Figure 3. AIEC LF82 bacteria induce production of VEGF in CEABAC 10 transgenic mice. Representative brown immunohistochemical staining for VEGF (A) and VEGFR-2 (B) in sections of the colonic mucosa from non-infected (NI) CEABAC 10 mice, or AIEC LF82- or non-pathogenic E. coli K12-infected CEABAC 10 and WT mice; (scale bar = 10 µm). Insets show cytoplasmic staining of VEGF (A) and VEGFR-2 (B) in epithelial cells located within crypts of CEABAC 10 mice infected with LF82 bacteria. Arrows point to cytoplasmic staining within epithelial cells and arrowheads indicate endothelial cell staining. *, muscularis mucosa. (C) Secretion of VEGF, KC and MIP-2 was measured in colon supernatants from AIEC LF82-infected WT (n = 7) or CEABAC 10 (n = 7) mice. An increase in secreted VEGF concentration in CEABAC 10 mice infected with LF82 bacteria was measured by ELISA. Results shown here are representative of two separate experiments.
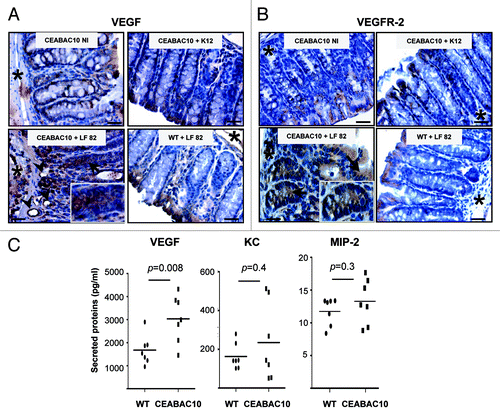
Figure 3. AIEC LF82 bacteria induce production of VEGF in CEABAC 10 transgenic mice. Representative brown immunohistochemical staining for VEGF (A) and VEGFR-2 (B) in sections of the colonic mucosa from non-infected (NI) CEABAC 10 mice, or AIEC LF82- or non-pathogenic E. coli K12-infected CEABAC 10 and WT mice; (scale bar = 10 µm). Insets show cytoplasmic staining of VEGF (A) and VEGFR-2 (B) in epithelial cells located within crypts of CEABAC 10 mice infected with LF82 bacteria. Arrows point to cytoplasmic staining within epithelial cells and arrowheads indicate endothelial cell staining. *, muscularis mucosa. (C) Secretion of VEGF, KC and MIP-2 was measured in colon supernatants from AIEC LF82-infected WT (n = 7) or CEABAC 10 (n = 7) mice. An increase in secreted VEGF concentration in CEABAC 10 mice infected with LF82 bacteria was measured by ELISA. Results shown here are representative of two separate experiments.

Figure 4. AIEC LF82-induced VEGF and IL-8 production require HIF-1α expression and NFκB signaling in human T84-IEC. (A) T84 cells were infected with increasing amounts of AIEC LF82 bacteria (from MOI of 1 to 100) or control commensal bacteria (clone 291071) for 2h. The HIF-1α protein was assayed by immunoblotting using an anti-HIF-1α antibody and the total actin level was monitored as a control for equal protein loading. We observed an increase in HIF-1α protein levels in cells infected with LF82 bacteria. (B) VEGF and IL-8 secretion by T84 and T84-Shhif-1α cells infected with AIEC LF82 or control commensal (clone 291071) bacteria was measured by ELISA as indicated in Materials and Methods. Data are expressed as the mean concentration of secreted proteins per 8 × 10⁶ cells for 4h ± s.e.m. (n = 3). VEGF and IL-8 mRNA level from T84 and T84-Shhif-1α cells infected with AIEC LF82 (MOI = 10) were quantified by qPCR. Data are expressed as the mean of the relative amount of mRNA expressed per 8 × 10⁶ cells ± s.e.m. (n = 4).). **p < 0.01 relative to values of non-infected T84 cells. ##p < 0.01 relative to values of LF82-infected vs. commensal (clone 291071)-infected T84 cells. ++p < 0.01 relative to values of LF82-infected T84 cells vs. LF82-T84 depleted for hif-1α expression (T84-Shhif-1α) cells. LF82 bacteria induced production of VEGF and IL-8 is dependent on HIF-1α.
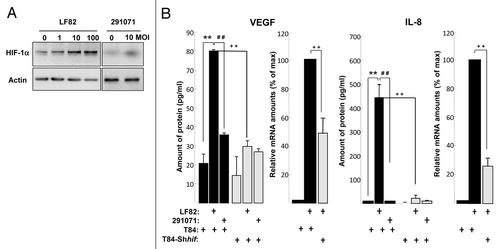
Figure 4. AIEC LF82-induced VEGF and IL-8 production require HIF-1α expression and NFκB signaling in human T84-IEC. (A) T84 cells were infected with increasing amounts of AIEC LF82 bacteria (from MOI of 1 to 100) or control commensal bacteria (clone 291071) for 2h. The HIF-1α protein was assayed by immunoblotting using an anti-HIF-1α antibody and the total actin level was monitored as a control for equal protein loading. We observed an increase in HIF-1α protein levels in cells infected with LF82 bacteria. (B) VEGF and IL-8 secretion by T84 and T84-Shhif-1α cells infected with AIEC LF82 or control commensal (clone 291071) bacteria was measured by ELISA as indicated in Materials and Methods. Data are expressed as the mean concentration of secreted proteins per 8 × 10⁶ cells for 4h ± s.e.m. (n = 3). VEGF and IL-8 mRNA level from T84 and T84-Shhif-1α cells infected with AIEC LF82 (MOI = 10) were quantified by qPCR. Data are expressed as the mean of the relative amount of mRNA expressed per 8 × 10⁶ cells ± s.e.m. (n = 4).). **p < 0.01 relative to values of non-infected T84 cells. ##p < 0.01 relative to values of LF82-infected vs. commensal (clone 291071)-infected T84 cells. ++p < 0.01 relative to values of LF82-infected T84 cells vs. LF82-T84 depleted for hif-1α expression (T84-Shhif-1α) cells. LF82 bacteria induced production of VEGF and IL-8 is dependent on HIF-1α.

Figure 5. HIF-1α and NFκB signalings are interconnected. (A) protein gel blot analysis (upper panel) showed the effect of IKK-2 inhibitor (SC-514, 100 μM) added one hour prior the infection with AIEC LF82 (MOI of 10) on HIF-1α protein level. Quantification of immunoblot, using ImageJ software, (lower panel) demonstrated that blocking IKK-2 kinase activity results in a partial inhibition of HIF-1α protein expression. Data are expressed as the mean of amount of protein expression ± s.e.m. (n = 3). (B) Immunoblot showing HIF-1α and phosphorylation of IκB in T84 and T84-Shhif-1α cells infected for a 2 h period with AIEC LF82 bacteria (MOI = 10) or treated with TNFα for 45 and 120 min. The total actin level was monitored as a control for equal protein loading. This result highlights the ability of LF82 bacteria to induce phosphorylation of IκB in a HIF-1α dependent manner.
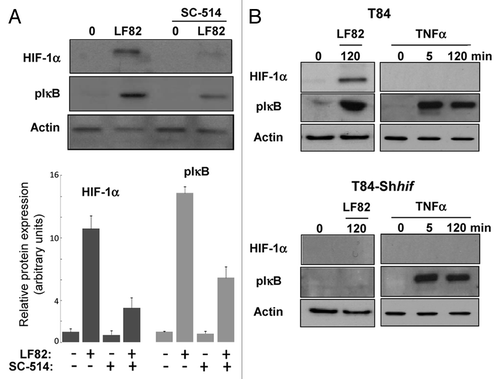
Figure 5. HIF-1α and NFκB signalings are interconnected. (A) protein gel blot analysis (upper panel) showed the effect of IKK-2 inhibitor (SC-514, 100 μM) added one hour prior the infection with AIEC LF82 (MOI of 10) on HIF-1α protein level. Quantification of immunoblot, using ImageJ software, (lower panel) demonstrated that blocking IKK-2 kinase activity results in a partial inhibition of HIF-1α protein expression. Data are expressed as the mean of amount of protein expression ± s.e.m. (n = 3). (B) Immunoblot showing HIF-1α and phosphorylation of IκB in T84 and T84-Shhif-1α cells infected for a 2 h period with AIEC LF82 bacteria (MOI = 10) or treated with TNFα for 45 and 120 min. The total actin level was monitored as a control for equal protein loading. This result highlights the ability of LF82 bacteria to induce phosphorylation of IκB in a HIF-1α dependent manner.

Figure 6. Type 1 pili and flagella expressed by AIEC LF82 bacteria enhance production of VEGF and IL-8 independently of cellular invasion. (A) Quantification of VEGF and IL-8 mRNA level by qPCR from LF82 or non-pathogen E. coli (clone 291071) infected T84 cells in the absence or presence of D-mannose (1%). D-mannose treatment partially inhibits LF82-induced VEGF and IL-8 mRNA expression. Data are expressed as the mean of the relative amount of mRNA expressed per 8 × 10⁶ cells ± s.e.m. (n = 3). **p < 0.01 relative to values of LF82-infected vs. 291071-infected T84 cells. ##, p < 0.01 relative to values of LF82-infected T84 cells in presence vs. absence of D-mannose. (B) Quantification of VEGF and IL-8 mRNA level by qPCR of bacteria (MOI = 10)-infected T84 cells showing the effect of LF82, LF82-ΔfimH, LF82-ΔfliC and LF82-ΔfliC/pPBI04 (isogenic ΔfliC mutant complemented for flagella and type 1 pili expression) bacteria. Type 1 pili (ΔfimH) and flagella (ΔfliC) are necessary to mediate LF82-induced increase on VEGF and IL-8 mRNA level. Data are expressed as the mean of the relative amount of mRNA in 8 × 10⁶ cells ± s.e.m. (n = 3). *p < 0.05, **p < 0.01 relative to values of LF82-infected vs. commensal-infected T84 cells. (C) Quantification of VEGF and IL-8 mRNA levels in LF82-infected T84 cells without or with cytochalasin D treatment (2µg/ml). This result indicates that cellular invasion is not necessary to mediate LF-82-induced production of angiogenic factors. Data are expressed as the mean of amount of relative mRNA expressed in 8 × 10⁶ cells ± s.e.m. (n = 3). ns: non statistically significant.
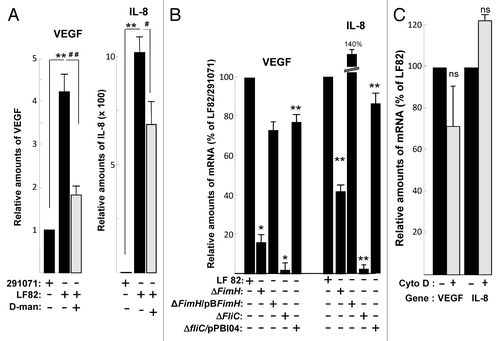
Figure 6. Type 1 pili and flagella expressed by AIEC LF82 bacteria enhance production of VEGF and IL-8 independently of cellular invasion. (A) Quantification of VEGF and IL-8 mRNA level by qPCR from LF82 or non-pathogen E. coli (clone 291071) infected T84 cells in the absence or presence of D-mannose (1%). D-mannose treatment partially inhibits LF82-induced VEGF and IL-8 mRNA expression. Data are expressed as the mean of the relative amount of mRNA expressed per 8 × 10⁶ cells ± s.e.m. (n = 3). **p < 0.01 relative to values of LF82-infected vs. 291071-infected T84 cells. ##, p < 0.01 relative to values of LF82-infected T84 cells in presence vs. absence of D-mannose. (B) Quantification of VEGF and IL-8 mRNA level by qPCR of bacteria (MOI = 10)-infected T84 cells showing the effect of LF82, LF82-ΔfimH, LF82-ΔfliC and LF82-ΔfliC/pPBI04 (isogenic ΔfliC mutant complemented for flagella and type 1 pili expression) bacteria. Type 1 pili (ΔfimH) and flagella (ΔfliC) are necessary to mediate LF82-induced increase on VEGF and IL-8 mRNA level. Data are expressed as the mean of the relative amount of mRNA in 8 × 10⁶ cells ± s.e.m. (n = 3). *p < 0.05, **p < 0.01 relative to values of LF82-infected vs. commensal-infected T84 cells. (C) Quantification of VEGF and IL-8 mRNA levels in LF82-infected T84 cells without or with cytochalasin D treatment (2µg/ml). This result indicates that cellular invasion is not necessary to mediate LF-82-induced production of angiogenic factors. Data are expressed as the mean of amount of relative mRNA expressed in 8 × 10⁶ cells ± s.e.m. (n = 3). ns: non statistically significant.

Table 1. Adherent and invasive characteristics of strains used in this study

Figure 7. AIEC LF82-induced cell signaling pathways require binding of flagella to TLR5. (A) Quantification of VEGF and IL-8 mRNA by qPCR in LF82 (MOI = 10)-infected T84 cells pre-treated with anti-TLR5 and non-relevant antibodies indicates that LF82 bacterial component should interact with TLR5 to induce VEGF and IL-8 mRNA increase levels. Antibodies are added 1h prior to infection at 10 μg/ml. Data are expressed as the mean of the relative amount of mRNA expressed by 8 × 10⁶ cells ± s.e.m. (n = 3). *p < 0.05, **p < 0.01 relative to values of LF82-infected vs. commensal-infected T84 cells. (B) Immunoblot showing HIF-1α and phosphorylation of ERK, AKT and IκB in T84 cells before and after exposure to LF82 bacteria (MOI = 10) for indicated times (left panel) or indicated bacteria at a MOI of 10 for a 2 h period (right panel). The total actin level is monitored as a control for equal protein loading. Here we show that LF82 bacteria induce classical ERK, AKT and IκB signaling pathways. (C) Effect of cell signaling inhibitors on VEGF and IL-8 gene expression of LF82-infected T84 cells. MEK inhibitor (PD184352, 5 μM), PI-3 Kinase inhibitor (LY203580, 25 μM) and IKK inhibitor (SC-514, 100 μM) were added to the cells 1h prior to infection. ERK and IκB dependent signaling pathways are required to mediate LF82-induced production of angiogenic factors. Data are expressed as the mean of the relative amount of mRNA expressed by 8 × 10⁶ cells ± s.e.m. (n = 4). *p < 0.05, **p < 0.01 relative to values of LF82-infected vs. commensal-infected T84 cells.
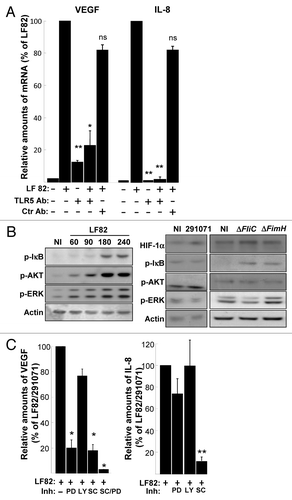
Figure 7. AIEC LF82-induced cell signaling pathways require binding of flagella to TLR5. (A) Quantification of VEGF and IL-8 mRNA by qPCR in LF82 (MOI = 10)-infected T84 cells pre-treated with anti-TLR5 and non-relevant antibodies indicates that LF82 bacterial component should interact with TLR5 to induce VEGF and IL-8 mRNA increase levels. Antibodies are added 1h prior to infection at 10 μg/ml. Data are expressed as the mean of the relative amount of mRNA expressed by 8 × 10⁶ cells ± s.e.m. (n = 3). *p < 0.05, **p < 0.01 relative to values of LF82-infected vs. commensal-infected T84 cells. (B) Immunoblot showing HIF-1α and phosphorylation of ERK, AKT and IκB in T84 cells before and after exposure to LF82 bacteria (MOI = 10) for indicated times (left panel) or indicated bacteria at a MOI of 10 for a 2 h period (right panel). The total actin level is monitored as a control for equal protein loading. Here we show that LF82 bacteria induce classical ERK, AKT and IκB signaling pathways. (C) Effect of cell signaling inhibitors on VEGF and IL-8 gene expression of LF82-infected T84 cells. MEK inhibitor (PD184352, 5 μM), PI-3 Kinase inhibitor (LY203580, 25 μM) and IKK inhibitor (SC-514, 100 μM) were added to the cells 1h prior to infection. ERK and IκB dependent signaling pathways are required to mediate LF82-induced production of angiogenic factors. Data are expressed as the mean of the relative amount of mRNA expressed by 8 × 10⁶ cells ± s.e.m. (n = 4). *p < 0.05, **p < 0.01 relative to values of LF82-infected vs. commensal-infected T84 cells.

Figure 8. AIEC LF82 bacteria induce inflammatory disorders via HIF-dependent responses. Binding of AIEC LF82’s type 1 pili and flagella to CEACAM-6 and TLR-5 receptors triggers induction of signaling pathways (IKK, MAPK). Consequently, NFκB and HIF-1α translocate to the nucleus where they cooperatively control VEGF and IL-8 transcription. Since AIEC are unable to induce phosphorylation of IκB in cells silenced for HIF-1α expression, we proposed that the expression of CEACAM-6 and TLR-5 receptors is under the control of the HIF-1 transcription factor.
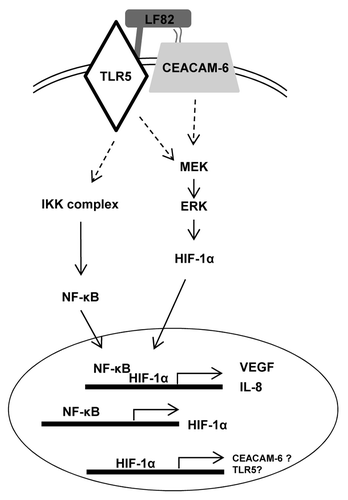
Figure 8. AIEC LF82 bacteria induce inflammatory disorders via HIF-dependent responses. Binding of AIEC LF82’s type 1 pili and flagella to CEACAM-6 and TLR-5 receptors triggers induction of signaling pathways (IKK, MAPK). Consequently, NFκB and HIF-1α translocate to the nucleus where they cooperatively control VEGF and IL-8 transcription. Since AIEC are unable to induce phosphorylation of IκB in cells silenced for HIF-1α expression, we proposed that the expression of CEACAM-6 and TLR-5 receptors is under the control of the HIF-1 transcription factor.

Reprints and Corporate Permissions

Please note: Selecting permissions does not provide access to the full text of the article, please see our help page How do I view content?

To request a reprint or corporate permissions for this article, please click on the relevant link below:

Academic Permissions

Please note: Selecting permissions does not provide access to the full text of the article, please see our help page How do I view content?

Obtain permissions instantly via Rightslink by clicking on the button below:

If you are unable to obtain permissions via Rightslink, please complete and submit this Permissions form. For more information, please visit our Permissions help page.