Figures & data
Table 1. Characteristic of study population (n = 11)
Figure 1. Hierarchical clustering of bacterial community profiles in rectal swabs and rectal biopsies. Bray-Curtis similarities were used to construct a dendrogram composed of the samples provided by the participants (1–11). Each participant is represented twice: rectal swab (green triangles) and rectal biopsy (blue triangles).
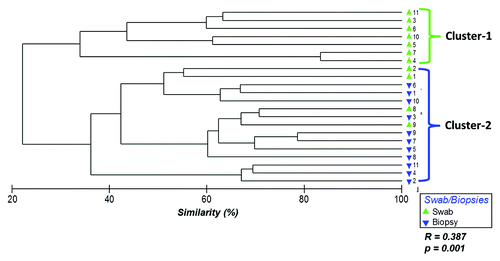
Figure 2. A Distribution of terminal-restriction fragments (T-RFs) in rectal swabs and rectal biopsies. Bars represent the average abundance of each T-RF grouped by biopsies (red) or swabs (blue). Asterisks represent T-RFs that are significantly different (p < 0.05) between rectal biopsies and rectal swabs as assessed by t-test.
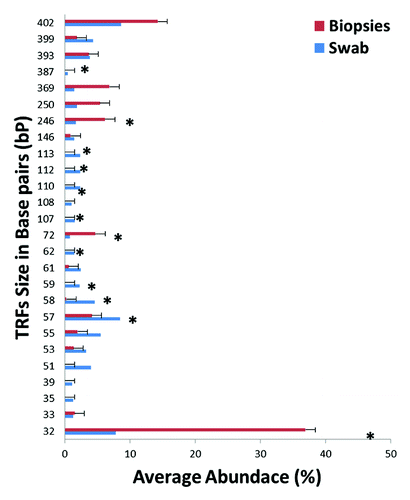
Figure 3. Measures of T-RF diversity in rectal swabs and rectal biopsies. Bars represent average diversity as estimated by T-RF richness (p = 0.014), evenness (p = 0.058) and Shannon’s diversity (p = 0.04). Calculated standard error is represented atop each bar graph. Statistical significance (*) was calculated by t-test.
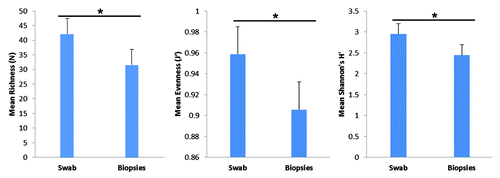
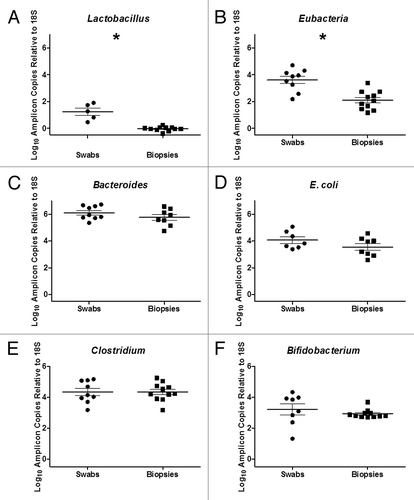
Figure 4. Quantitative PCR of Bacterial 16S RNA Gene of (A) Lactobacillus spp, (B) Eubacteria, (C) Bacteroides spp., (D) E. coli, (E) Clostridium spp and (F) Bifidobacterium spp in rectal swabs and rectal biopsies. A significant increase in Lactobacillus spp (p < 0.0001) and Eubacterium spp (p = 0.0003) was observed in rectal swabs compared with rectal biopsies (*).