1,889
Views
112
CrossRef citations to date
0
Altmetric
Research Paper

Nod1 and Nod2 signaling does not alter the composition of intestinal bacterial communities at homeostasis

, , , , , & show all
Pages 222-231 | Received 23 Jan 2013, Accepted 19 Mar 2013, Published online: 02 Apr 2013

Figures & data

Table 1. Quantitative real time PCR primers for targeted mouse genes

Figure 1. Relative expression of target genes in the ileum of Nod1 (A) and Nod2 (B) littermates (mean control value set to 1).
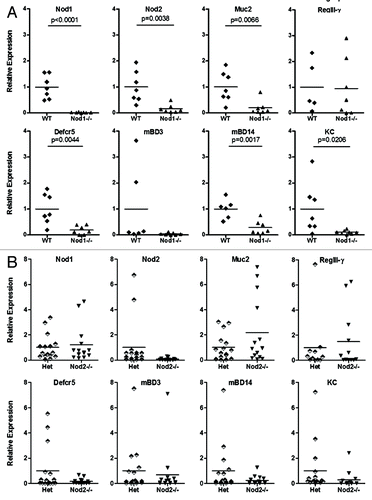
Figure 1. Relative expression of target genes in the ileum of Nod1 (A) and Nod2 (B) littermates (mean control value set to 1).

Table 2. Quantitative real time PCR primers for bacterial group-specific16S rDNA

Figure 2. Relative abundance of targeted bacterial groups in the ileum of Nod1 non-littermates, including co-caged WT and Nod1−/− females (A) and Nod1 littermates (B).
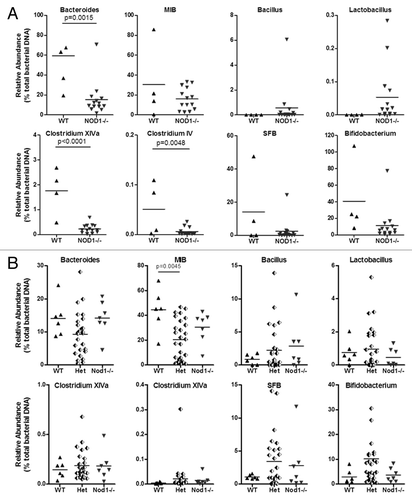
Figure 2. Relative abundance of targeted bacterial groups in the ileum of Nod1 non-littermates, including co-caged WT and Nod1−/− females (A) and Nod1 littermates (B).

Figure 3. NMS ordination of bacterial community structure in the ileum of WT and Nod1−/− mice under different housing conditions. Littermates tend to cluster closely together while there is greater separation between genotypes of the non-littermate mice. Co-caged mice (open symbols) tend to separate from the other groups.
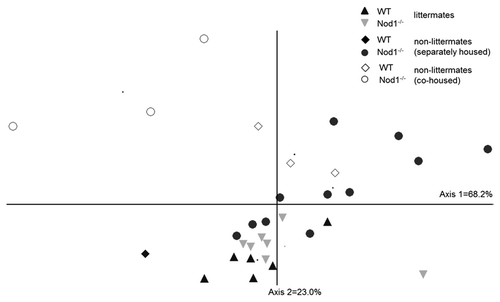
Figure 3. NMS ordination of bacterial community structure in the ileum of WT and Nod1−/− mice under different housing conditions. Littermates tend to cluster closely together while there is greater separation between genotypes of the non-littermate mice. Co-caged mice (open symbols) tend to separate from the other groups.

Figure 4. Relative abundance of targeted bacterial groups in the ileum of Het and Nod2−/− littermates. Variation within litters is shown by the different shading of points on each graph.
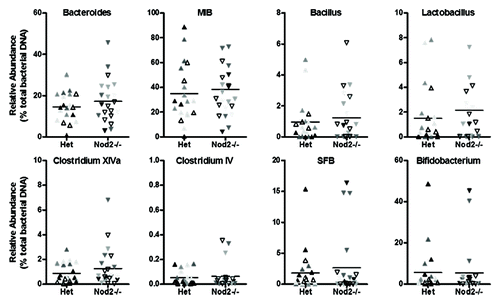
Figure 4. Relative abundance of targeted bacterial groups in the ileum of Het and Nod2−/− littermates. Variation within litters is shown by the different shading of points on each graph.

Figure 5. NMS ordination of bacterial community structure (from fragment analysis by LH-PCR) in the cecum of WT and Rip2−/− showing variation between litters at 8 and 16 weeks. The community structure of 8-week mice did not vary significantly from each other but the 16-week mice varied from the 8-week mice as well as with each other, regardless of genotype.
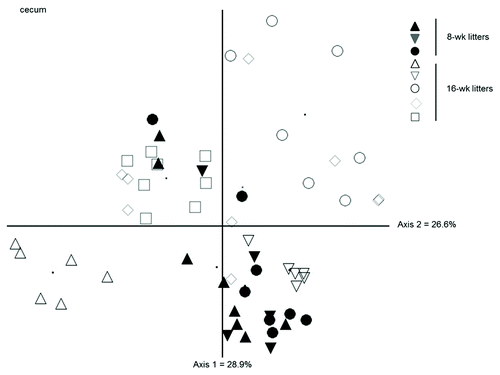
Figure 5. NMS ordination of bacterial community structure (from fragment analysis by LH-PCR) in the cecum of WT and Rip2−/− showing variation between litters at 8 and 16 weeks. The community structure of 8-week mice did not vary significantly from each other but the 16-week mice varied from the 8-week mice as well as with each other, regardless of genotype.
Supplemental material

Additional material

Download Zip (615.2 KB)

Reprints and Corporate Permissions

Please note: Selecting permissions does not provide access to the full text of the article, please see our help page How do I view content?

To request a reprint or corporate permissions for this article, please click on the relevant link below:

Academic Permissions

Please note: Selecting permissions does not provide access to the full text of the article, please see our help page How do I view content?

Obtain permissions instantly via Rightslink by clicking on the button below:

If you are unable to obtain permissions via Rightslink, please complete and submit this Permissions form. For more information, please visit our Permissions help page.