1,473
Views
14
CrossRef citations to date
0
Altmetric
Review

Biomarkers of Helicobacter pylori-associated gastric cancer

, &
Pages 532-540 | Received 12 Jun 2013, Accepted 11 Jul 2013, Published online: 12 Jul 2013

Figures & data

Figure 1. Schematic representation of the main clinical outcomes of H. pylori infection. The right side of the figure shows the sequential steps of the precancerous cascade. Reproduced from reference Citation13 with permission from John Wiley and Sons.
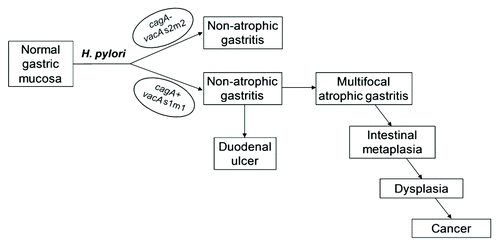
Figure 1. Schematic representation of the main clinical outcomes of H. pylori infection. The right side of the figure shows the sequential steps of the precancerous cascade. Reproduced from reference Citation13 with permission from John Wiley and Sons.

Reprints and Corporate Permissions

Please note: Selecting permissions does not provide access to the full text of the article, please see our help page How do I view content?

To request a reprint or corporate permissions for this article, please click on the relevant link below:

Academic Permissions

Please note: Selecting permissions does not provide access to the full text of the article, please see our help page How do I view content?

Obtain permissions instantly via Rightslink by clicking on the button below:

If you are unable to obtain permissions via Rightslink, please complete and submit this Permissions form. For more information, please visit our Permissions help page.