2,310
Views
41
CrossRef citations to date
0
Altmetric
Research Paper

Discordance between changes in the gut microbiota and pathogenicity in a mouse model of spontaneous colitis

, , , , , , , , , , & show all
Pages 286-485 | Received 18 Dec 2013, Accepted 21 Mar 2014, Published online: 24 Mar 2014

Figures & data

Figure 1. Germ-free TM IEC C1galt1−/− mice did not develop inflammation. (A) FISH staining with universal probes demonstrated robust colonization (bacteria stained in red) of the conventionalized (ex-germ-free) mice. Mucosa-associated bacteria increased in the conventionalized TM-IEC C1galt1−/− mice. Gene deletion induced a decrease in the mucus layer (black space, between bacteria -in red- and epithelial cells -in blue) relative to the WT control. Alcian Blue staining showed a decrease in mucus production by goblet cells (black arrows point at goblet cells in the WT mice). H&E was used to assess epithelial hyperplasia in the colon. Conventionalized TM-IEC C1galt1−/− developed a high degree of epithelial hyperplasia. Differences in the appearance of the tissue and length of the crypts were observed in the conventionalized TM-IEC C1galt1−/− mice compared with the GF counterpart and the WT controls. (B) Data represents the mean thickness of the inner mucus layer obtained from 3 to 13 animals for each genotype from both, conventionalized and germ-free mice. Statistics were determined by 1-Way ANOVA with Bonferonni’s post-test. Error bars = SEM (C) GF TM-IEC C1galt1−/− mice did not develop inflammation relative to conventionalized TM-IEC C1galt1−/− mice based on the established parameters. For (B) and (C), error bars represent standard deviations. P values were estimated for changes between genotypes (WT vs. TM-IEC C1galt1−/−).
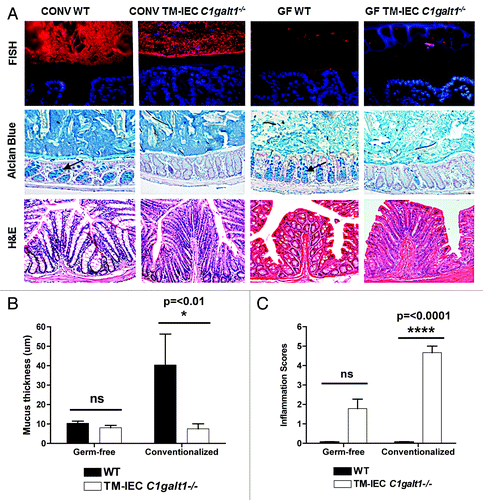
Figure 1. Germ-free TM IEC C1galt1−/− mice did not develop inflammation. (A) FISH staining with universal probes demonstrated robust colonization (bacteria stained in red) of the conventionalized (ex-germ-free) mice. Mucosa-associated bacteria increased in the conventionalized TM-IEC C1galt1−/− mice. Gene deletion induced a decrease in the mucus layer (black space, between bacteria -in red- and epithelial cells -in blue) relative to the WT control. Alcian Blue staining showed a decrease in mucus production by goblet cells (black arrows point at goblet cells in the WT mice). H&E was used to assess epithelial hyperplasia in the colon. Conventionalized TM-IEC C1galt1−/− developed a high degree of epithelial hyperplasia. Differences in the appearance of the tissue and length of the crypts were observed in the conventionalized TM-IEC C1galt1−/− mice compared with the GF counterpart and the WT controls. (B) Data represents the mean thickness of the inner mucus layer obtained from 3 to 13 animals for each genotype from both, conventionalized and germ-free mice. Statistics were determined by 1-Way ANOVA with Bonferonni’s post-test. Error bars = SEM (C) GF TM-IEC C1galt1−/− mice did not develop inflammation relative to conventionalized TM-IEC C1galt1−/− mice based on the established parameters. For (B) and (C), error bars represent standard deviations. P values were estimated for changes between genotypes (WT vs. TM-IEC C1galt1−/−).

Figure 2. Deficiency of Core 1 O-glycans is associated with microbial changes that are the net result of increases in Clostridium and Lactobacillus species and decreases in unclassified Lachnospiraceae, unclassified Prevotellaceae and unclassified Ruminococcaceae in the mice gut. (A) Unweighted UniFrac (non-abundance) cluster tree and PCA graph, performed to assess similarities in microbial communities between the genotypes, revealed two distinct microbial communities in left colon content (LCC) samples. KO: TM-IEC C1galt1−/− mice. Red dots and lines represent the WT mice. Green dots and lines represent the TM-IEC C1galt1−/− mice. (B) Lack of core 1 O-glycans caused increases in Firmicutes in the LCC at the phylum level. (C) Increases in Firmicutes are the net result of statistically significant increases in Clostridium and Lactobacillus population and decreases in unclassified Ruminocccaceae. (D) Statistical analyses of OTUs showed changes in 8 OTUs specific to the LCC of the TM-IEC C1galt1−/− mice. These OTUs are represented by Clostridium disporicum, Lactobacillus intestinalis, Lactobacillus johnsonii, which are increased in the LCC of the mice; and Anaerotruncus colihominis, Allobaculum stercoricanis, Eubacterium biforme and Parabacteroides distasonis, which are decreased in the mice colon. For (C) and (D), horizontal lines represent means. n = 3–4 for each anatomical site tested, data points equal to zeros are not shown as the y-axis is in log10 scale.
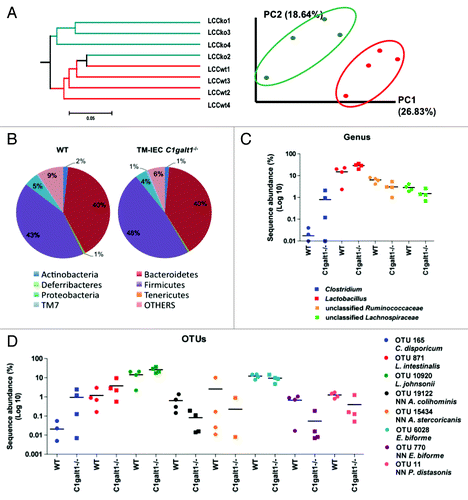
Figure 2. Deficiency of Core 1 O-glycans is associated with microbial changes that are the net result of increases in Clostridium and Lactobacillus species and decreases in unclassified Lachnospiraceae, unclassified Prevotellaceae and unclassified Ruminococcaceae in the mice gut. (A) Unweighted UniFrac (non-abundance) cluster tree and PCA graph, performed to assess similarities in microbial communities between the genotypes, revealed two distinct microbial communities in left colon content (LCC) samples. KO: TM-IEC C1galt1−/− mice. Red dots and lines represent the WT mice. Green dots and lines represent the TM-IEC C1galt1−/− mice. (B) Lack of core 1 O-glycans caused increases in Firmicutes in the LCC at the phylum level. (C) Increases in Firmicutes are the net result of statistically significant increases in Clostridium and Lactobacillus population and decreases in unclassified Ruminocccaceae. (D) Statistical analyses of OTUs showed changes in 8 OTUs specific to the LCC of the TM-IEC C1galt1−/− mice. These OTUs are represented by Clostridium disporicum, Lactobacillus intestinalis, Lactobacillus johnsonii, which are increased in the LCC of the mice; and Anaerotruncus colihominis, Allobaculum stercoricanis, Eubacterium biforme and Parabacteroides distasonis, which are decreased in the mice colon. For (C) and (D), horizontal lines represent means. n = 3–4 for each anatomical site tested, data points equal to zeros are not shown as the y-axis is in log10 scale.

Figure 3. Intestinal symbiont Bacteroides thetaiotaomicron is capable of inducing colitis in the absence of core 1 O-glycans. (A) Assessment of epithelial hyperplasia in WT and TM-IEC C1galt1−/− monocolonized mice showed differences in the appearance of the tissue between the genotypes (monoassociated WT vs monoassociated TM-IEC C1galt1−/−) caused by increases in volume as a consequence of increases in the number of epithelial cells. AB staining revealed an impaired mucus production by the goblet cells (“empty” crypts, lack of blue stain observed in the TM IEC C1galt1−/− mice). FISH analysis revealed robust colonization by Bacteroides spp. in both WT and TM-IEC C1galt1−/− mice, and moderate or weak colonization by the other bacteria tested. (B) The TM-IEC C1galt1−/− conventionalized mice (with a complete microbiota) presented the highest degree of hyperplasia among all bacterial treatments. Monoassociation with B. thetaiotaomicron caused the highest degree of hyperplasia among the monoassociation experiments. Bars represent fold change over WT; error bars represent standard deviations. P values were estimated for changes between genotypes (WT vs. TM-IEC C1galt1−/−).
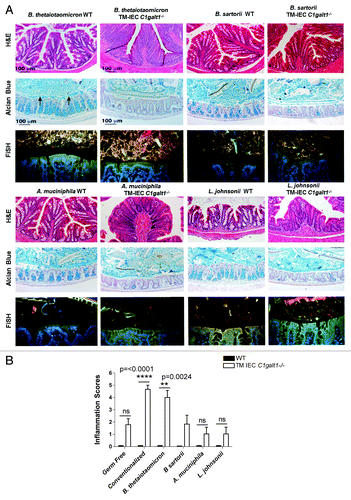
Figure 3. Intestinal symbiont Bacteroides thetaiotaomicron is capable of inducing colitis in the absence of core 1 O-glycans. (A) Assessment of epithelial hyperplasia in WT and TM-IEC C1galt1−/− monocolonized mice showed differences in the appearance of the tissue between the genotypes (monoassociated WT vs monoassociated TM-IEC C1galt1−/−) caused by increases in volume as a consequence of increases in the number of epithelial cells. AB staining revealed an impaired mucus production by the goblet cells (“empty” crypts, lack of blue stain observed in the TM IEC C1galt1−/− mice). FISH analysis revealed robust colonization by Bacteroides spp. in both WT and TM-IEC C1galt1−/− mice, and moderate or weak colonization by the other bacteria tested. (B) The TM-IEC C1galt1−/− conventionalized mice (with a complete microbiota) presented the highest degree of hyperplasia among all bacterial treatments. Monoassociation with B. thetaiotaomicron caused the highest degree of hyperplasia among the monoassociation experiments. Bars represent fold change over WT; error bars represent standard deviations. P values were estimated for changes between genotypes (WT vs. TM-IEC C1galt1−/−).
Supplemental material

Additional material

Download Zip (3.4 MB)