819
Views
6
CrossRef citations to date
0
Altmetric
Research Paper

Immune response to JC virus T antigen in patients with and without colorectal neoplasia

, , , , &
Pages 468-475 | Received 18 Mar 2014, Accepted 12 Jun 2014, Published online: 09 Jul 2014

Figures & data

Table 1. Summary of the patients enrolled in the study

Figure 1. IL-10-fold change heatmap. The fold change of the supernatant levels of IL-10 from the three groups compared with the NC, as evaluated on Day 2, NC is a negative control. The clusters are listed across the top and the three cohorts are listed on the y axis.
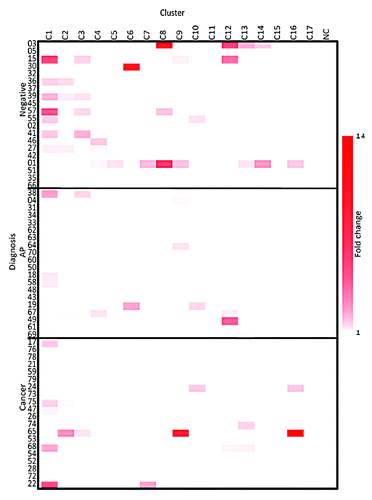
Figure 1. IL-10-fold change heatmap. The fold change of the supernatant levels of IL-10 from the three groups compared with the NC, as evaluated on Day 2, NC is a negative control. The clusters are listed across the top and the three cohorts are listed on the y axis.
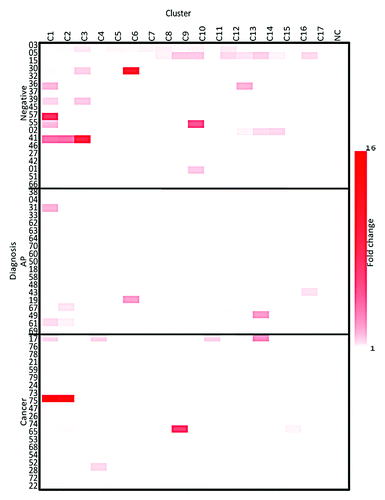
Figure 2. IL-13-fold change heatmap. The fold change of the supernatant levels of IL-13 from the three groups compared with the NC, as evaluated on Day 2, NC is a negative control. The clusters are listed across the top and the three cohorts are listed on the y axis.
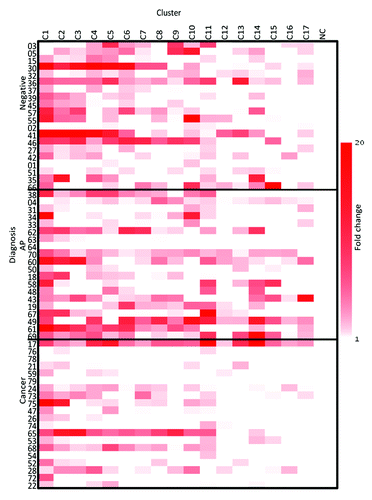
Figure 2. IL-13-fold change heatmap. The fold change of the supernatant levels of IL-13 from the three groups compared with the NC, as evaluated on Day 2, NC is a negative control. The clusters are listed across the top and the three cohorts are listed on the y axis.
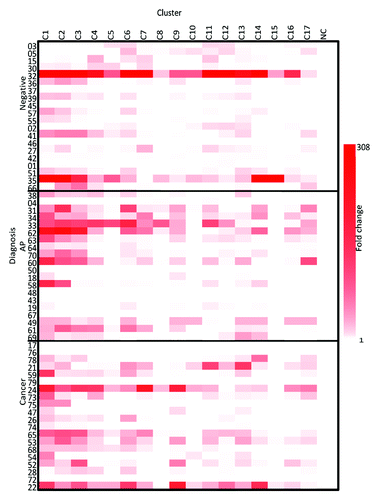
Figure 3. IL-2-fold change heatmap. The fold change of the supernatant levels of IL-2 from the three groups compared with the NC, as evaluated on Day 2, NC is a negative control. The clusters are listed across the top and the three cohorts are listed on the y axis.

Figure 3. IL-2-fold change heatmap. The fold change of the supernatant levels of IL-2 from the three groups compared with the NC, as evaluated on Day 2, NC is a negative control. The clusters are listed across the top and the three cohorts are listed on the y axis.

Figure 4. IP-10-fold change heatmap. The fold change of the supernatant levels of IP-10 from the three groups compared with the NC, as evaluated on Day 2. NC is a negative control. The clusters are listed across the top and the three cohorts are listed on the y axis.

Figure 4. IP-10-fold change heatmap. The fold change of the supernatant levels of IP-10 from the three groups compared with the NC, as evaluated on Day 2. NC is a negative control. The clusters are listed across the top and the three cohorts are listed on the y axis.

Figure 5. CD4+ and CD8+ T cell proliferation. (A) CD4+ and CD8+ T cell proliferation. The CD4+ T cell proliferation is the first set of 3 for the cohorts and the CD8+ T cell proliferation is the second set of the three cohorts. T cells are represented as the percentage of total cells. Standard error of the mean is represented above each column. (B) CD4+ and CD8+ T cell proliferation from a strong stimulating cluster. Representative patients for T cell proliferation from the three groups for cluster 1, a cluster stimulating a strong response. CFSE decreases in replicating cells, indicated by a population shift to the left. The CD4+ and CD8+ staining is indicated on the y axis and the CFSE staining is on the x axis. (C) CD4+ and CD8+ T cell proliferation from a poorly stimulating cluster. Representative patients for T cell proliferation from the three groups for cluster 15, representing a weak response. CFSE decreases in replicating cells, indicated by a population shift to the left. The CD4+ and CD8+ staining is indicated on the y axis and the CFSE staining is on the x axis.
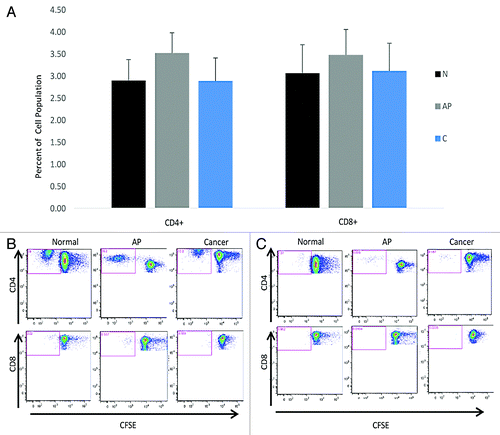
Figure 5. CD4+ and CD8+ T cell proliferation. (A) CD4+ and CD8+ T cell proliferation. The CD4+ T cell proliferation is the first set of 3 for the cohorts and the CD8+ T cell proliferation is the second set of the three cohorts. T cells are represented as the percentage of total cells. Standard error of the mean is represented above each column. (B) CD4+ and CD8+ T cell proliferation from a strong stimulating cluster. Representative patients for T cell proliferation from the three groups for cluster 1, a cluster stimulating a strong response. CFSE decreases in replicating cells, indicated by a population shift to the left. The CD4+ and CD8+ staining is indicated on the y axis and the CFSE staining is on the x axis. (C) CD4+ and CD8+ T cell proliferation from a poorly stimulating cluster. Representative patients for T cell proliferation from the three groups for cluster 15, representing a weak response. CFSE decreases in replicating cells, indicated by a population shift to the left. The CD4+ and CD8+ staining is indicated on the y axis and the CFSE staining is on the x axis.

Table 2. The amino acids in the peptide clusters for T Antigen stimulation of PBMCs

Supplemental material

Additional material

Download Zip (82.6 KB)

Reprints and Corporate Permissions

Please note: Selecting permissions does not provide access to the full text of the article, please see our help page How do I view content?

To request a reprint or corporate permissions for this article, please click on the relevant link below:

Academic Permissions

Please note: Selecting permissions does not provide access to the full text of the article, please see our help page How do I view content?

Obtain permissions instantly via Rightslink by clicking on the button below:

If you are unable to obtain permissions via Rightslink, please complete and submit this Permissions form. For more information, please visit our Permissions help page.