Figures & data
Figure 1. (A) Histological staining of prostate tissue from control rats immunized with dendritic cells pulsed with PAP (in the absence of GM-CSF) were indistinguishable from the normal architecture of the prostate. (B) Histological staining of prostate tissue from rats immunized with PAP+GM-CSF-pulsed dendritic cells a total of 3 times with 2-week intervals. (reproduced from Sims RB, 2011Citation52)
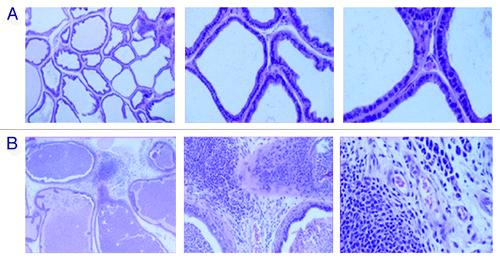
Figure 2. A full course of treatment with sipuleucel-T comprises 3 doses at approximately 2-week intervals. The leukapheresis product undergoes a series of buoyant density separations to isolate PBMCs for incubation with PA2024 for 36–44 h. Following this incubation, the cells are washed, resuspended in lactated Ringer’s solution, and returned to the patient.
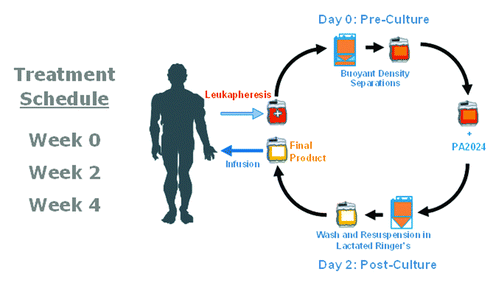
Figure 3. Cellular composition, as measured by flow cytometry, of the leukapheresis product and the final sipuleucel-T product for each of the 3 doses of sipuleucel-T that comprise a full course of treatment. This analysis was conducted in a subset of patients in the IMPACT trial19 who received at least 1 sipuleucel-T infusion.
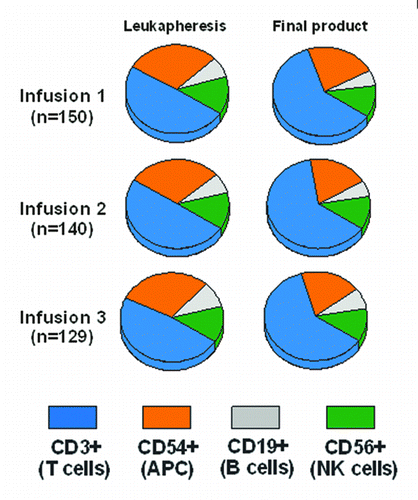
Figure 4. (A) CD54 upregulation is determined by calculating the relative increase in CD54 expression in the final product compared with the leukapheresis product following buoyant density separations to isolate PMBCs. (B) Relative CD54 upgregulation (fold change) during the first, second, and third manufacture of control (C) and sipuleucel-T (S).CD54 upregulation was measured as previously describedCitation24 in samples obtained in the D9901/D9902A trials.Citation18,Citation33
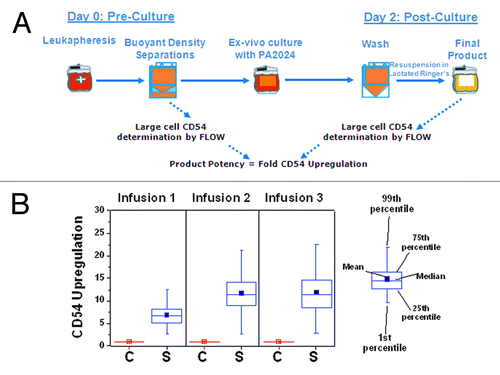
Figure 5. Cellular viability following incubation of PBMCs obtained from healthy subjects with media alone, media+GM-CSF, and media+PA2024 (Data on file; Dendreon Corp).
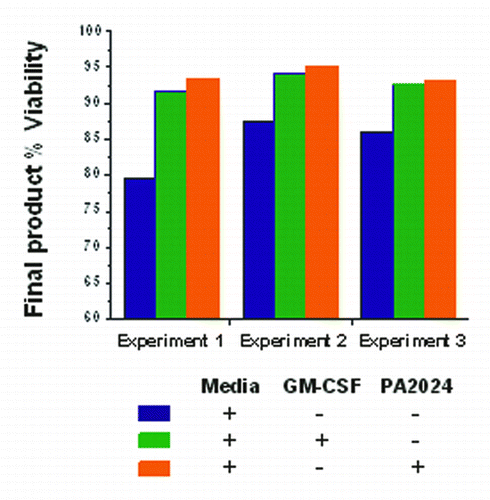
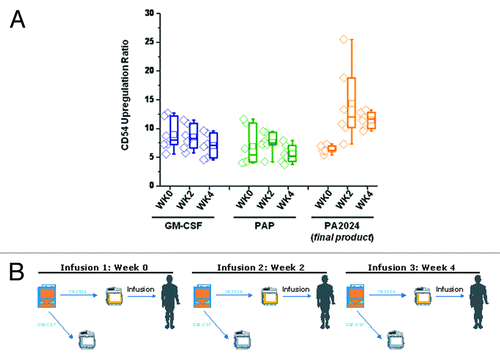
Figure 6. (A) CD54 upregulation in sipuleucel-T-treated subjects following incubation with GM-CSF, PAP, and PA2024 (n = 6). CD54 upregulation was assessed as previously described from samples obtained from the NeoACT (Clinicaltrials.gov identifier: NCT00715104) and ProACT (Clinicaltrials.gov identifier: NCT00715078) clinical trials. (B) Each sample obtained for data presented in the top panel was obtained during the course of normal sipuleucel-T treatment, comprising 3 doses at approximately 2-week intervals.