Figures & data
Figure 1. CONSORT subject disposition chart.
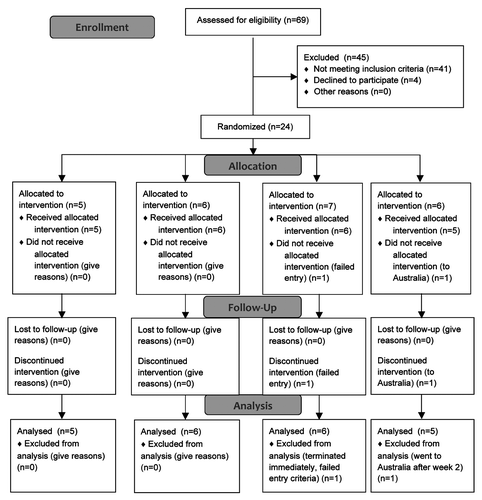
Table 1. Baseline demographics and injection related adverse reactions
Figure 2. Mean changes from baseline of anti-Tat antibody concentrations following TUTI-16 immunization. Treatment naïve HIV subjects (solid lines): placebo red circle, 30 μg TUTI-16 blue circle, 100 μg TUTI-16 brown square, 600 μg TUTI-16 plum diamond. Healthy HIV seronegative subjects (dashed lines): 200 μg TUTI-16 orange hexagonal, 1.0 mg TUTI-16 orange square; ART controlled HIV subjects: 200 μg TUTI-16 magenta diamond. Treatment naïve HIV randomized study immunizations at 0, 4 and 12 weeks; open label immunizations at 0 and 3 weeks.
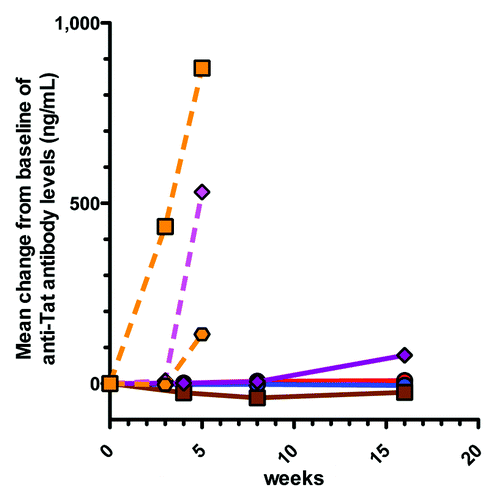
Figure 3. Baseline log HIV viral counts (mean ± SEM).
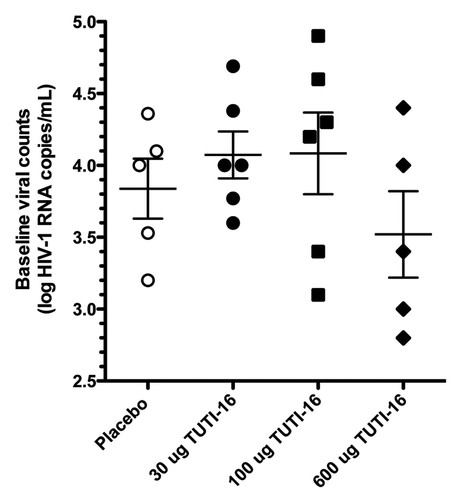
Figure 4. Mean changes from baseline of log viral count during the 5 mo following the initial immunization. Each point represents the mean of 6 determinations from a single subject. ++pc0.01
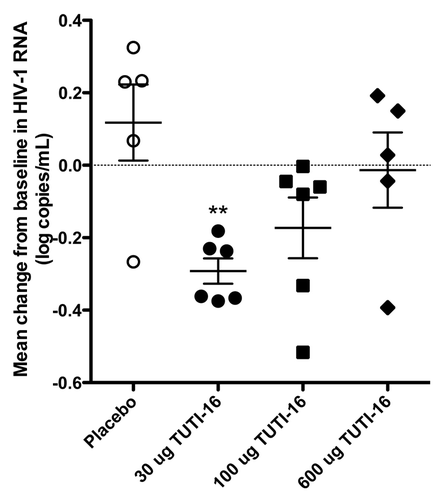
Figure 5. Baseline CD4 T cell counts (mean ± SEM).
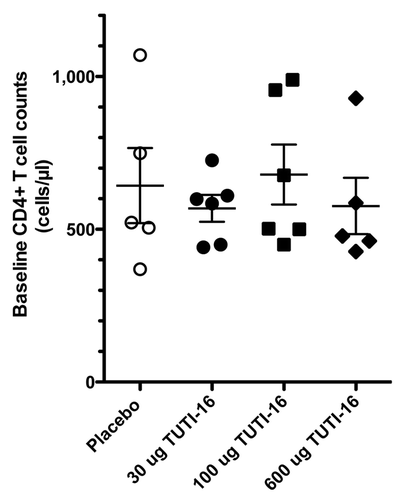
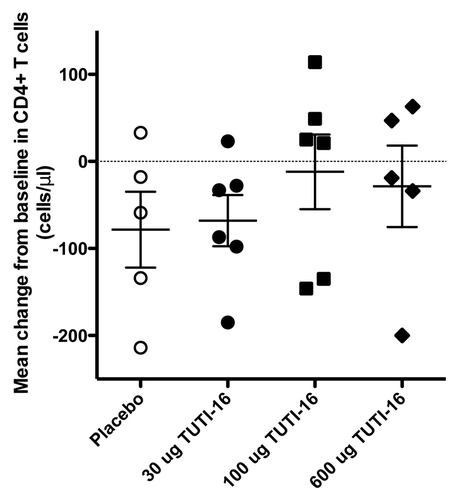
Figure 6. Mean change from baseline of CD4 T cell counts in each treatment group during the 5 mo following the first immunization.