1,291
Views
16
CrossRef citations to date
0
Altmetric
Research Paper

The human potential of a recombinant pandemic influenza vaccine produced in tobacco plants

, , , , &
Pages 653-661 | Received 17 Nov 2011, Accepted 27 Jan 2012, Published online: 01 May 2012

Figures & data

Table 1. Demographics of the enrolled volunteers

Figure 1. Solicited adverse events after vaccination in the enrolled volunteers. The frequency of local and systemic adverse events for volunteers included in the study. Data are based on diary cards completed by the 23 subjects in the study. “Any” refers to the report of an adverse event on one or more days after vaccination.
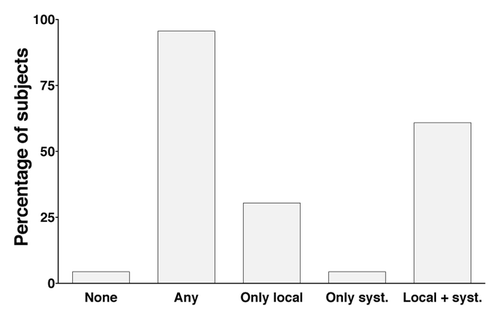
Figure 1. Solicited adverse events after vaccination in the enrolled volunteers. The frequency of local and systemic adverse events for volunteers included in the study. Data are based on diary cards completed by the 23 subjects in the study. “Any” refers to the report of an adverse event on one or more days after vaccination.

Figure 2. Immunogenicity of the pdmH1N1 vaccine. (A) serum SRH titers for the enrolled volunteers pre-vaccination, and 7, 14, 21 d (d) post vaccination. (B) serum HI titers for the enrolled volunteers pre-vaccination, and 7, 14, 21 d (d) and 3, 6 and 12 mo (m) post vaccination. Each symbol in A and B represents one individual serum sample and lines indicate geometric mean area (GMA) or geometric mean titer (GMT) ± 95% confidence interval. The number of sera (n) included at each time point is indicated. (C) The reverse cumulative distribution curves for the HI antibody response. The HI data was standardized according to a conversion factor based on the GMT of the Candidate International Standard (09/194) in a collaborative study, as the Candidate International Standard has not been assigned International Units. Dotted lines indicate protective levels as defined by the Committee for Medicinal Products for Human Use (CHMP).
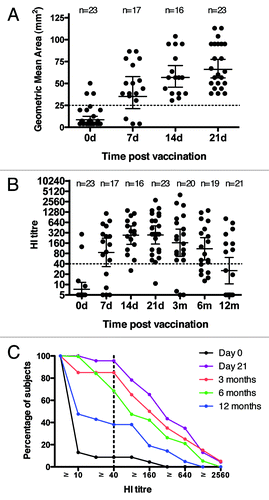
Figure 2. Immunogenicity of the pdmH1N1 vaccine. (A) serum SRH titers for the enrolled volunteers pre-vaccination, and 7, 14, 21 d (d) post vaccination. (B) serum HI titers for the enrolled volunteers pre-vaccination, and 7, 14, 21 d (d) and 3, 6 and 12 mo (m) post vaccination. Each symbol in A and B represents one individual serum sample and lines indicate geometric mean area (GMA) or geometric mean titer (GMT) ± 95% confidence interval. The number of sera (n) included at each time point is indicated. (C) The reverse cumulative distribution curves for the HI antibody response. The HI data was standardized according to a conversion factor based on the GMT of the Candidate International Standard (09/194) in a collaborative study, as the Candidate International Standard has not been assigned International Units. Dotted lines indicate protective levels as defined by the Committee for Medicinal Products for Human Use (CHMP).

Figure 3. Human B-cells detecting HAC1. Human peripheral blood mononuclear cells (PBMCs) isolated 7 d post vaccination were analyzed by ELISPOT to identify antibody secreting cells (ASCs) recognizing the HAC1 antigen or the vaccine antigen. For each sample the number of B-cells secreting specific antibodies of the IgG, IgA and IgM classes were quantified in 100,000 PBMCs. Each symbol represents one individual volunteer. Lines indicate the mean ± standard error of the mean (SEM). n = 15
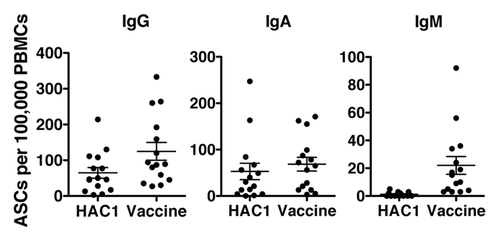
Figure 3. Human B-cells detecting HAC1. Human peripheral blood mononuclear cells (PBMCs) isolated 7 d post vaccination were analyzed by ELISPOT to identify antibody secreting cells (ASCs) recognizing the HAC1 antigen or the vaccine antigen. For each sample the number of B-cells secreting specific antibodies of the IgG, IgA and IgM classes were quantified in 100,000 PBMCs. Each symbol represents one individual volunteer. Lines indicate the mean ± standard error of the mean (SEM). n = 15

Figure 4. Human serum antibodies detecting HAC1. HAC1 detecting IgG antibodies were measured by ELISA on serum collected pre vaccination and at 7, 14 and 21 d (d) and 3, 6 and 12 mo (m) post vaccination. Each symbol represents one individual serum sample. Lines represent the mean ± standard error of the mean (SEM). ** and *** indicate concentrations significantly different from day 0 with p < 0.005 and p < 0.0005, respectively. The number of sera (n) included at each time point is indicated.
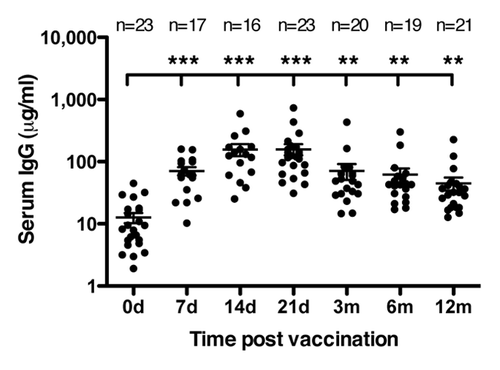
Figure 4. Human serum antibodies detecting HAC1. HAC1 detecting IgG antibodies were measured by ELISA on serum collected pre vaccination and at 7, 14 and 21 d (d) and 3, 6 and 12 mo (m) post vaccination. Each symbol represents one individual serum sample. Lines represent the mean ± standard error of the mean (SEM). ** and *** indicate concentrations significantly different from day 0 with p < 0.005 and p < 0.0005, respectively. The number of sera (n) included at each time point is indicated.

Figure 5. In vitro induction of cytokine secretion from human PBMCs by HAC1. Human PBMCs isolated 21 d post vaccination were stimulated in vitro with HAC1 or the vaccine antigen or left non-stimulated (Neg) for 3 d and the level of 10 different cytokines was measured in the cell supernatant by multiplex cytokine assay. Each symbol represents one individual volunteer. Bars represent the mean ± standard error of the mean (SEM). * and ** indicate significant difference with p < 0.05 and p < 0.005, respectively. n = 19.
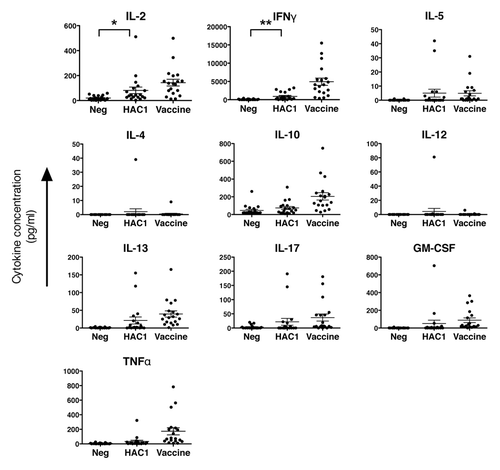
Figure 5. In vitro induction of cytokine secretion from human PBMCs by HAC1. Human PBMCs isolated 21 d post vaccination were stimulated in vitro with HAC1 or the vaccine antigen or left non-stimulated (Neg) for 3 d and the level of 10 different cytokines was measured in the cell supernatant by multiplex cytokine assay. Each symbol represents one individual volunteer. Bars represent the mean ± standard error of the mean (SEM). * and ** indicate significant difference with p < 0.05 and p < 0.005, respectively. n = 19.

Figure 6. HAC1 activation of multifunctional T cells. Human PBMCs isolated 21 d post vaccination were stimulated in vitro with HAC1 or the vaccine antigen or left non-stimulated (Neg) overnight. Cells were then fixed and analyzed for the presence of multifunctional T cells producing one or more of the cytokines TNFα, IL-2 and IFNγ by multi-parametric flow cytometry. (A) Total frequency of CD4+ cells producing each of the cytokines investigated. (B) Frequency of CD4+ cells producing only one, any two or all three of the cytokines investigated. *, ** and *** indicate significant difference with p < 0.05, p < 0.005 and p < 0.0005, respectively. Bars represent the mean ± standard error of the mean (SEM). n = 19.
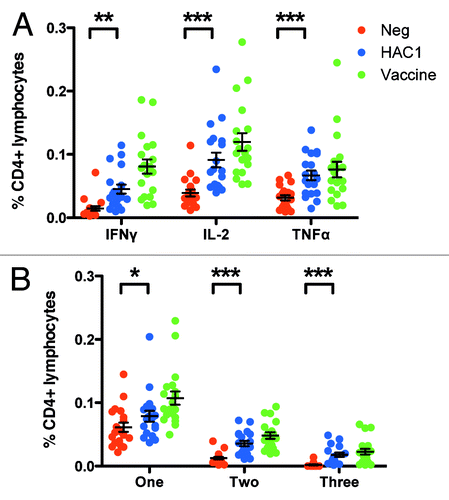
Figure 6. HAC1 activation of multifunctional T cells. Human PBMCs isolated 21 d post vaccination were stimulated in vitro with HAC1 or the vaccine antigen or left non-stimulated (Neg) overnight. Cells were then fixed and analyzed for the presence of multifunctional T cells producing one or more of the cytokines TNFα, IL-2 and IFNγ by multi-parametric flow cytometry. (A) Total frequency of CD4+ cells producing each of the cytokines investigated. (B) Frequency of CD4+ cells producing only one, any two or all three of the cytokines investigated. *, ** and *** indicate significant difference with p < 0.05, p < 0.005 and p < 0.0005, respectively. Bars represent the mean ± standard error of the mean (SEM). n = 19.