1,379
Views
6
CrossRef citations to date
0
Altmetric
Research Paper

Filterable forms and L-forms of Mycobacterium bovis BCG

Impact for live vaccine features

, &
Pages 759-764 | Published online: 12 Apr 2012

Figures & data

Figure 1. Light microscopy of control BCG-D colony (A), and typical “fried eggs” L-form colonies grown on Middlebrook 7H9 semisolid agar: colonies of filterable forms developed from control BCG-BG suspension (B) and (C) and .colonies obtained after starvation of BCG-BG (D) and (E) and BCG-D cultures (F). Magnification: (C)–200x; (A), (B), (D), (E) and (F)-400x; (F)-800x.
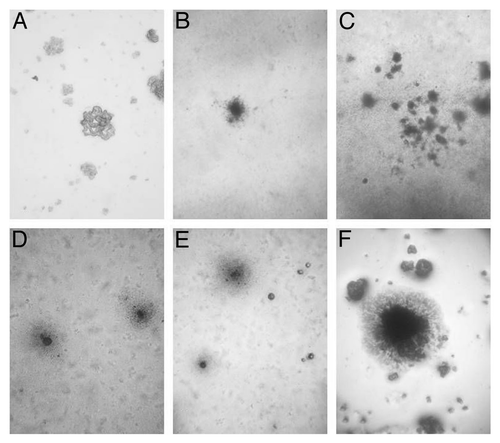
Figure 1. Light microscopy of control BCG-D colony (A), and typical “fried eggs” L-form colonies grown on Middlebrook 7H9 semisolid agar: colonies of filterable forms developed from control BCG-BG suspension (B) and (C) and .colonies obtained after starvation of BCG-BG (D) and (E) and BCG-D cultures (F). Magnification: (C)–200x; (A), (B), (D), (E) and (F)-400x; (F)-800x.

Figure 2. SEM of cells from culture of control strains: BCG-BG- (A), (B) and (E); and BCG-D- (C), (D) and (F). Typical single rod shaped bacilli (A) and (C), bacterial clusters (B) and (D), and filterable forms which size is similar or smaller than pore size of bacterial filter (E) and (F), arrows. Bar (white lines) = 10µm (A), (B) and (D); 1 µm (C), (E) and (F)
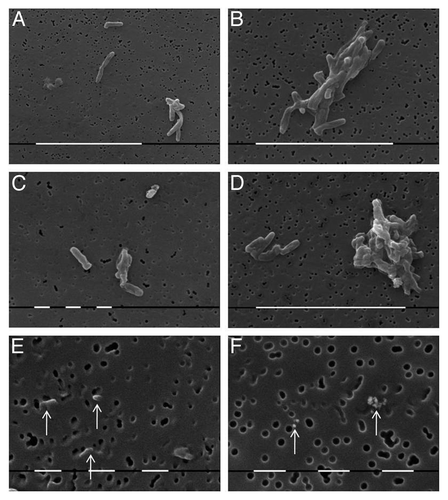
Figure 2. SEM of cells from culture of control strains: BCG-BG- (A), (B) and (E); and BCG-D- (C), (D) and (F). Typical single rod shaped bacilli (A) and (C), bacterial clusters (B) and (D), and filterable forms which size is similar or smaller than pore size of bacterial filter (E) and (F), arrows. Bar (white lines) = 10µm (A), (B) and (D); 1 µm (C), (E) and (F)

Figure 3. SEM of BCG subpopulation developed after filtration of control suspension: Clusters of granular forms and L-elementary bodies (A) and (B) or disperse single bodies of varied size (C) and (D), small rod shaped bacilli and filterable forms (E) and (F), arrows. Bar = 1µm (a, c, e); 10µm (b, d, f), Bar = 1µm
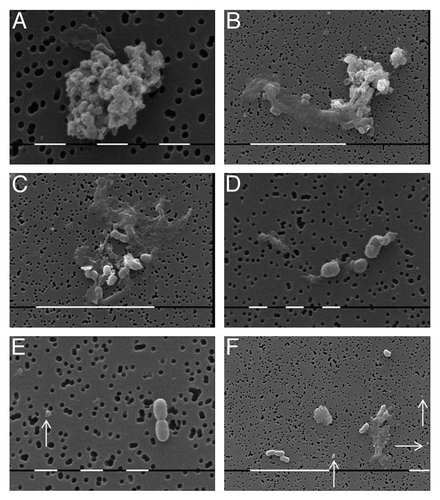
Figure 3. SEM of BCG subpopulation developed after filtration of control suspension: Clusters of granular forms and L-elementary bodies (A) and (B) or disperse single bodies of varied size (C) and (D), small rod shaped bacilli and filterable forms (E) and (F), arrows. Bar = 1µm (a, c, e); 10µm (b, d, f), Bar = 1µm

Figure 4. SEM of BCG cultures after starvation stress: BCG-BG – (A), (E), (F) and BCG-D- (B), (C), (D). Typical L-form cells: spherical large bodies (A) and (B) giant “mother” cells (C) and (E), elongated forms (A) and (D), small elementary bodies and granules (C), (E) and (F). Bar = 100 µm (A); 10 µm (b, c, e, f); 1 µm (D)
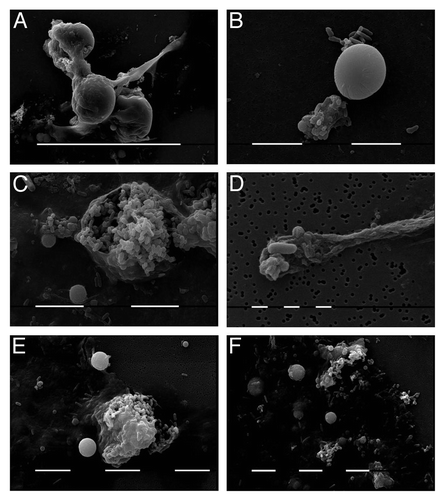
Figure 4. SEM of BCG cultures after starvation stress: BCG-BG – (A), (E), (F) and BCG-D- (B), (C), (D). Typical L-form cells: spherical large bodies (A) and (B) giant “mother” cells (C) and (E), elongated forms (A) and (D), small elementary bodies and granules (C), (E) and (F). Bar = 100 µm (A); 10 µm (b, c, e, f); 1 µm (D)

Figure 5. TEM of BCG-BG cell ultrathin sections (longitudinal and transversal) from: Control culture of dividing cells with cell walls and cytoplasm substructures of ribosomes and nucleoid (A) and (B); Stress starved culture- cells with separated cell walls (C), wall less bacterial cells (D), elongated L-forms with elementary bodies located inside (E) and single spherical L-bodies (F). Bar = 0.2µm
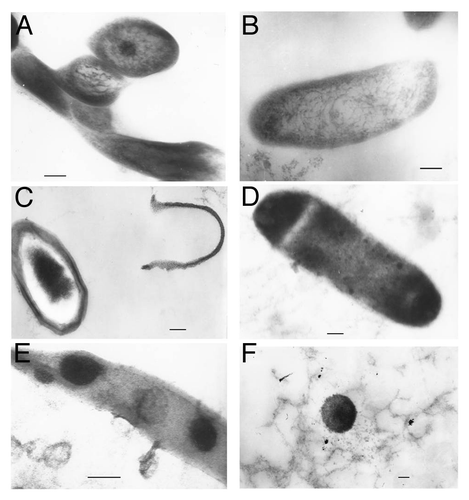
Figure 5. TEM of BCG-BG cell ultrathin sections (longitudinal and transversal) from: Control culture of dividing cells with cell walls and cytoplasm substructures of ribosomes and nucleoid (A) and (B); Stress starved culture- cells with separated cell walls (C), wall less bacterial cells (D), elongated L-forms with elementary bodies located inside (E) and single spherical L-bodies (F). Bar = 0.2µm

Figure 6.pncA allele-specific PCR. Amplifications were performed with chromosomal DNA from M. bovis (3); M. tuberculosis H37Rv (4); M. bovis BCG-BG, L-form (5); M. bovis BCG-D, L-form (6); M. bovis BCG-BG, filtered culture (7) and M. bovis BCG-D, filtered culture (8). PCR controls with water were also included, lines 2 and 9. All samples in gel A were tested with primers specific for M. tuberculosis, whereas all samples in gel B - with primers specific for M. bovis. DNA ladder (100–1000bp) was used in line 1 as size marker in both gels.
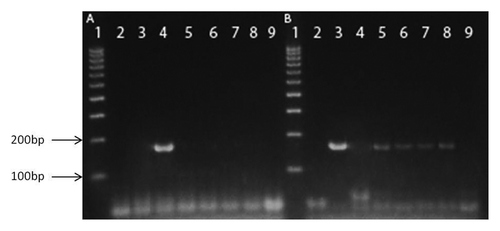
Figure 6.pncA allele-specific PCR. Amplifications were performed with chromosomal DNA from M. bovis (3); M. tuberculosis H37Rv (4); M. bovis BCG-BG, L-form (5); M. bovis BCG-D, L-form (6); M. bovis BCG-BG, filtered culture (7) and M. bovis BCG-D, filtered culture (8). PCR controls with water were also included, lines 2 and 9. All samples in gel A were tested with primers specific for M. tuberculosis, whereas all samples in gel B - with primers specific for M. bovis. DNA ladder (100–1000bp) was used in line 1 as size marker in both gels.

Reprints and Corporate Permissions

Please note: Selecting permissions does not provide access to the full text of the article, please see our help page How do I view content?

To request a reprint or corporate permissions for this article, please click on the relevant link below:

Academic Permissions

Please note: Selecting permissions does not provide access to the full text of the article, please see our help page How do I view content?

Obtain permissions instantly via Rightslink by clicking on the button below:

If you are unable to obtain permissions via Rightslink, please complete and submit this Permissions form. For more information, please visit our Permissions help page.