Figures & data
Figure 1. CONSORT subject disposition chart.
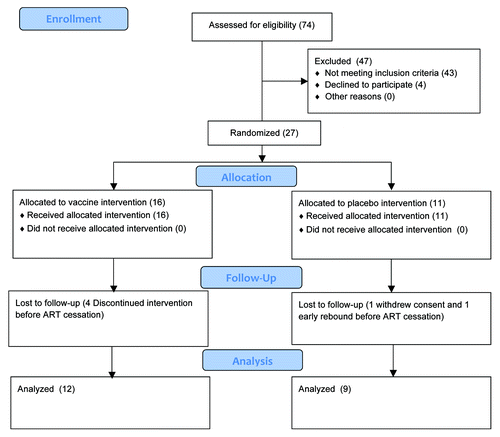
Table 1. Baseline demographics and injection related adverse reactions
Figure 2. Baseline CD4 T cell counts (mean ± SEM) demonstrating successful randomization at study entry.
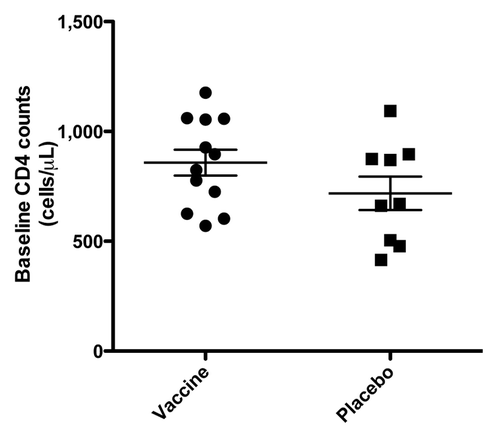
Figure 4. Kaplan-Meier rebound-free survival graph. Solid line denotes vaccine, interrupted line placebo. Rebound was defined as viral load greater than 3,000 HIV RNA copies/mL plasma.
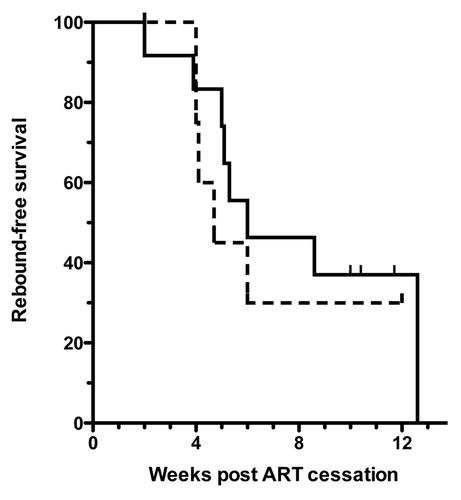
Figure 5. Consolidated times from ART cessation to rebound or to non-rebound status at study termination for all analyzed subjects. Dotted horizontal line at 4 weeks indicates maximal time to rebound for 90% of subjects in earlier STI studies. Horizontal bars denote mean ± SEM.
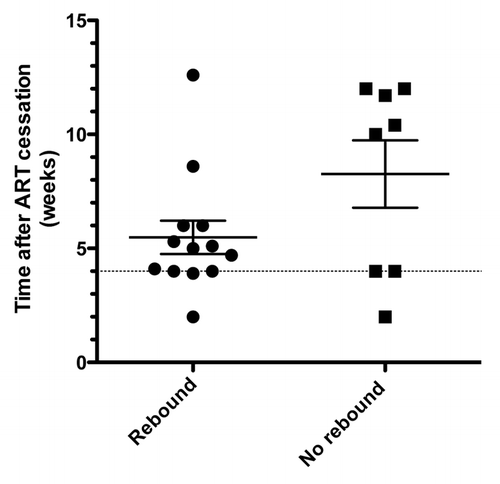
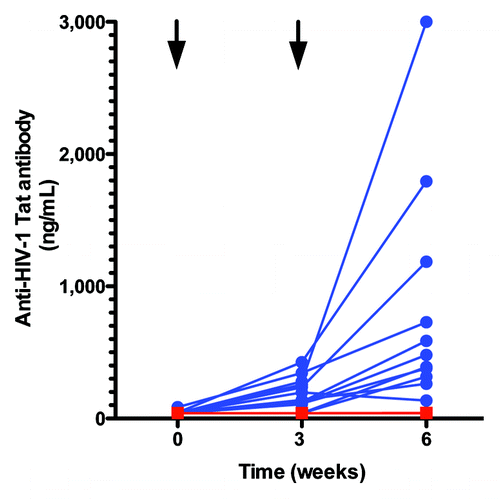
Figure 3. Changes in anti-Tat antibody levels after TUTI-16 (blue) or placebo (red) injections. Arrows denote injection times. The blue lines and symbols represent individual vaccinated subjects. The red line and symbols show the non-responsiveness of the placebo group and two non-responding vaccine subjects are concealed behind this line. TUTI-16 induced antibody levels < 40 ng/mL were previously shown to lower plasma HIV levels in asymptomatic ART naïve HIV infected subjects.Citation18