Figures & data
Figure 1. Biologic characteristics of transgenic plant-expressed HPV16L1 and LT-B. (A) Extracted protein from HPV16L1-transformed plants shows 50~60 nm hollow spherical particles when observed by electron micrograph (50000x), which are consistent with HPV16 VLPs (arrows). (B) The capacity of plant-derived LT-B binding to GM1 ganglioside. (C) The histology of intestine mucous membrane after oral LT administration (HE20x). The intestinal villus appears normal in the LT-B group, but is heavily swollen and dropsical in the control group. (D) The weight of small intestine from mice after administration of LT orally. *p < 0.05 vs. control group.
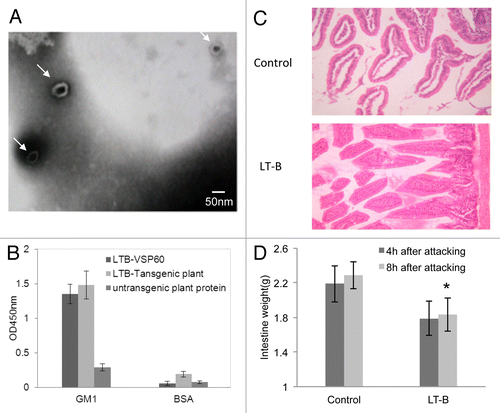
Figure 2. Specific IgG and IgA level of HPV16L1 in immunized mice. (A and B) HPV16L1 specific IgG (A) and IgA (B) levels in serum of immunized mice. (C) HPV16L1 specific IgA levels in intestine secretion. *p < 0.05 vs. control group, #p < 0.05 vs. HPV16L1 group. (D) Hemagglutination inhibition assay (HAI). The ratios shown below are dilutions of the sera polyclonal antibodies.
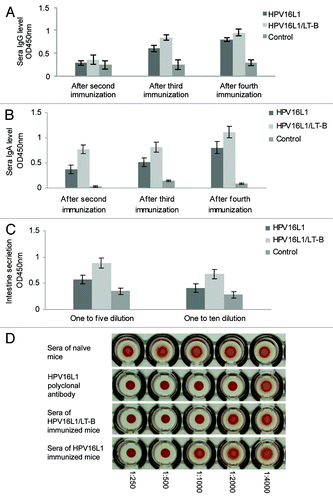
Figure 3. Specific IgG and IgA level of LT-B in immunized mice. (A and B) LT-B specific IgG (A) and IgA (B) levels in serum of immunized mice. *p < 0.05 vs. control group.
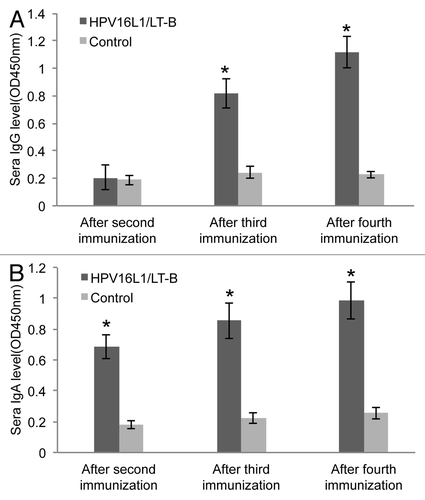
Figure 4. Antigen-specific responses of splenic cells. (A) HPV16VLPs induced antigen-specific proliferative assay of splenocytes. (B) The frequency of IL-4+/IFN-γ+cells in CD4+splenocytes from immunized mice by flow cytometry analysis. (C) IL-4/IFN-γ level in supernatant of HPV16VLP stimulated splenic cells from immunized mice. *p < 0.05 vs. control group, #p < 0.05 vs. HPV16L1 group.
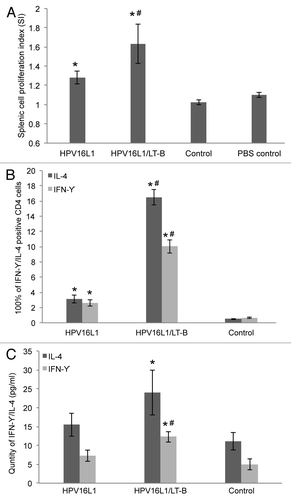
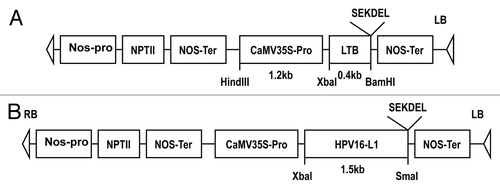
Figure 5. Schematic representation of T-DNA of the binary plasmid pBI-LTBs (A) and pBI-L1s (B).