832
Views
25
CrossRef citations to date
0
Altmetric
Research Paper

Relevance of a pre-existing measles immunity prior immunization with a recombinant measles virus vector

, , , , &
Pages 599-606 | Received 20 Oct 2012, Accepted 06 Nov 2012, Published online: 16 Jan 2013

Figures & data

Figure 1. hCD46tg mice were given 0, 500, 2,000 or 5,000 mIU MV-nAb i.v., respectively, one day prior i.m. immunization with 1 × 10⁵ pfu rMV-SIVgag. UV-inactivated virus and mice that did not receive measles nAb prior immunization served as controls. Measles antibody titers were determined by endpoint titration at day one and week 2. Fold increase of the median titers between these two time-points are shown in the different groups.
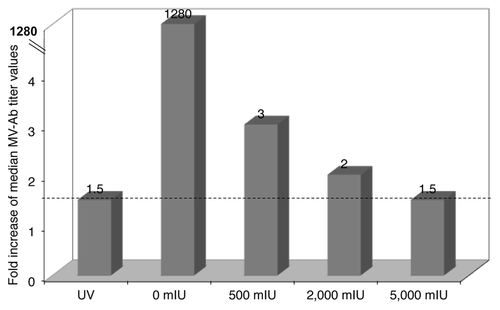
Figure 1. hCD46tg mice were given 0, 500, 2,000 or 5,000 mIU MV-nAb i.v., respectively, one day prior i.m. immunization with 1 × 10⁵ pfu rMV-SIVgag. UV-inactivated virus and mice that did not receive measles nAb prior immunization served as controls. Measles antibody titers were determined by endpoint titration at day one and week 2. Fold increase of the median titers between these two time-points are shown in the different groups.

Figure 2. Humoral response against MV. hCD46tg mice were given 500 mIU MV-nAb one day prior to immunization i.m. (panel A) or i.n. (panel B) with 1 × 10⁵ pfu rMV-SIVgag. Development of MV antibody titers over time is shown as median values in lines. The i.m. boost was performed at week 4 with 1 × 10⁵ pfu rMV-SIVgag. Arrows show the time points of immunization.
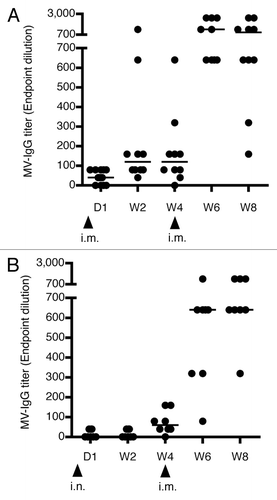
Figure 2. Humoral response against MV. hCD46tg mice were given 500 mIU MV-nAb one day prior to immunization i.m. (panel A) or i.n. (panel B) with 1 × 10⁵ pfu rMV-SIVgag. Development of MV antibody titers over time is shown as median values in lines. The i.m. boost was performed at week 4 with 1 × 10⁵ pfu rMV-SIVgag. Arrows show the time points of immunization.

Figure 3. Induction of neutralization antibodies against MV in pre-immune hCD46tg mice by an i.m.-i.m or i.n.-i.m. prime-boost scenario. Transgenic mice were given MV-nAb (i.v.) one day prior to immunization with 1 × 10⁵ pfu rMV-SIVgag. The concentration of antibodies are shown on panel (A) i.m.-i.m., and panel (B) i.n.-i.m. The i.m. boost of all mice groups was performed at 4 weeks post the prime. Neutralization anti MV antibodies were determined at week 4 (prior to boost) and 8 (after boost) are shown.
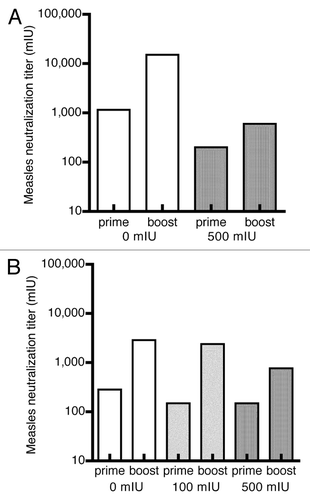
Figure 3. Induction of neutralization antibodies against MV in pre-immune hCD46tg mice by an i.m.-i.m or i.n.-i.m. prime-boost scenario. Transgenic mice were given MV-nAb (i.v.) one day prior to immunization with 1 × 10⁵ pfu rMV-SIVgag. The concentration of antibodies are shown on panel (A) i.m.-i.m., and panel (B) i.n.-i.m. The i.m. boost of all mice groups was performed at 4 weeks post the prime. Neutralization anti MV antibodies were determined at week 4 (prior to boost) and 8 (after boost) are shown.

Figure 4. Induction of humoral immune responses against SIVgag. hCD46tg mice were given 0 or 500 mIU MV-nAb prior to i.m. or i.n. immunization with 1 × 10⁵ pfu rMVSIVgag. Samples were collected at 4 weeks post prime i.m. (panel A) or i.n. (panel B) and 4 weeks post i.m. boost with 1 × 10⁵ pfu rMV-SIVgag. The median values are shown as lines.
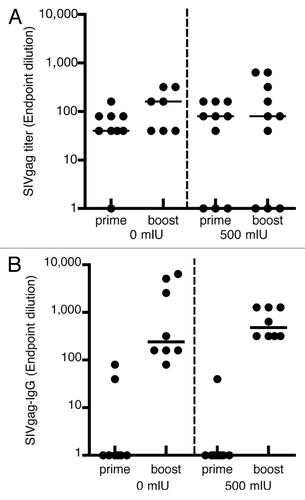
Figure 4. Induction of humoral immune responses against SIVgag. hCD46tg mice were given 0 or 500 mIU MV-nAb prior to i.m. or i.n. immunization with 1 × 10⁵ pfu rMVSIVgag. Samples were collected at 4 weeks post prime i.m. (panel A) or i.n. (panel B) and 4 weeks post i.m. boost with 1 × 10⁵ pfu rMV-SIVgag. The median values are shown as lines.

Figure 5. Cellular immune response against MV and the transgene, SIVgag. hCD46tg mice were given 0 or 500 mIU MV-nAb, one day prior to either i.m. or i.n. immunization with 1 × 10⁵ pfu rMV-SIVgag. ELISPOTs were performed 2 weeks post immunization. Panels A and B represent the intramuscular (i.m.) immunization and the measurement of cellular immune response against MV-N (Panel A) and SIVgag (Panel B). Panels C and D represent the intranasal (i.n.) immunization and the measurement of cellular immune responses against MV-N (Panel C) and SIVgag (Panel D). The lines represent the median values.
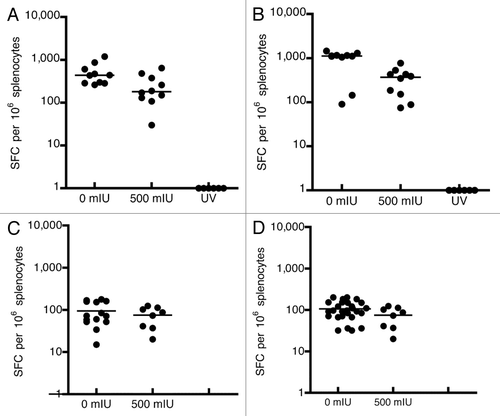
Figure 5. Cellular immune response against MV and the transgene, SIVgag. hCD46tg mice were given 0 or 500 mIU MV-nAb, one day prior to either i.m. or i.n. immunization with 1 × 10⁵ pfu rMV-SIVgag. ELISPOTs were performed 2 weeks post immunization. Panels A and B represent the intramuscular (i.m.) immunization and the measurement of cellular immune response against MV-N (Panel A) and SIVgag (Panel B). Panels C and D represent the intranasal (i.n.) immunization and the measurement of cellular immune responses against MV-N (Panel C) and SIVgag (Panel D). The lines represent the median values.

Reprints and Corporate Permissions

Please note: Selecting permissions does not provide access to the full text of the article, please see our help page How do I view content?

To request a reprint or corporate permissions for this article, please click on the relevant link below:

Academic Permissions

Please note: Selecting permissions does not provide access to the full text of the article, please see our help page How do I view content?

Obtain permissions instantly via Rightslink by clicking on the button below:

If you are unable to obtain permissions via Rightslink, please complete and submit this Permissions form. For more information, please visit our Permissions help page.