1,087
Views
12
CrossRef citations to date
0
Altmetric
Research Paper

Construction, expression and immunogenicity of a novel anti-hypertension angiotensin II vaccine based on hepatitis A virus-like particle

, , , , , , & show all
Pages 1191-1199 | Received 23 Nov 2012, Accepted 09 Feb 2013, Published online: 14 Feb 2013

Figures & data

Figure 1. (A) PCR products. Lane 1: DL5000 DNA marker; Lane 2: P1–2A-4Ang IIs; and Lane 3: 3ABC. (B) Double digestion of pFastBac™ Dual-P1–2A-4Ang IIs-3ABC.Lane 1: DL5000 DNA marker; Lane 2: P1–2A-4Ang IIs; and Lane 3: 3ABC. (C) PCR analysis. Lane 1: DL1000 DNA marker; Lane 2: primary M13; Lane 3: DL10000 DNA marker; and Lane 4: recombinant M13.
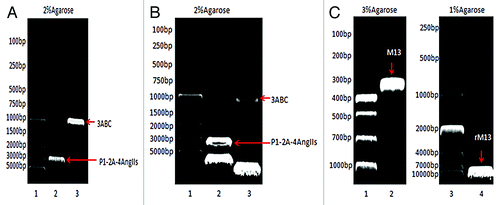
Figure 1. (A) PCR products. Lane 1: DL5000 DNA marker; Lane 2: P1–2A-4Ang IIs; and Lane 3: 3ABC. (B) Double digestion of pFastBac™ Dual-P1–2A-4Ang IIs-3ABC.Lane 1: DL5000 DNA marker; Lane 2: P1–2A-4Ang IIs; and Lane 3: 3ABC. (C) PCR analysis. Lane 1: DL1000 DNA marker; Lane 2: primary M13; Lane 3: DL10000 DNA marker; and Lane 4: recombinant M13.

Figure 2. RT-PCR analysis. Lane 1: DL5000 DNA marker; Lane 2:Detection of P1–2A-4Ang IIs in normal sf9 cells; Lane 3: Detection of P1–2A-4Ang IIs in infected sf9 cells; Lane 4: Detection of 3ABC in normal sf9 cells; and Lane 5: Detection of 3ABC in infected sf9 cells.
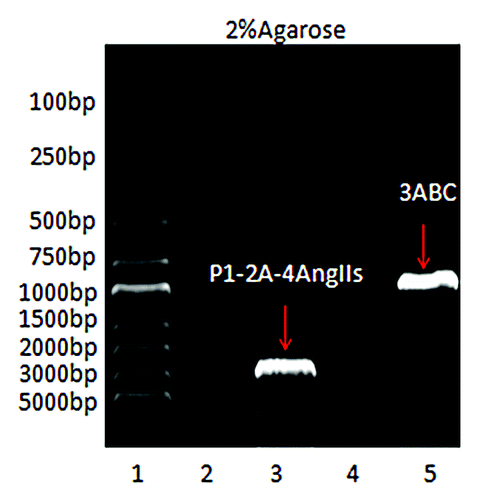
Figure 2. RT-PCR analysis. Lane 1: DL5000 DNA marker; Lane 2:Detection of P1–2A-4Ang IIs in normal sf9 cells; Lane 3: Detection of P1–2A-4Ang IIs in infected sf9 cells; Lane 4: Detection of 3ABC in normal sf9 cells; and Lane 5: Detection of 3ABC in infected sf9 cells.

Figure 3. (A) 12% SDS-PAGE analysis. Lane 1: protein molecular weight marker (kDa); Lane 2: normal sf9 cells; Lane 3: infected sf9 cells. The arrows (A) indicate the new foreign proteins. (B) Western blot identification for Ang II using an enhanced chemiluminescence (ECL) assay. The numbers to the left indicate positions of protein molecular weight marker (kDa). Lane 1: normal sf9 cells; Lane2: infected sf9 cells. Western blot exposed a specific protein bands at a molecular mass of~37 kDa, and the protein band may represent the VP1–2A-4Ang IIs subunit of pHAV-4Ang IIs.
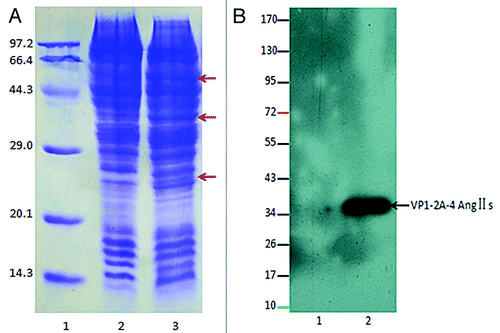
Figure 3. (A) 12% SDS-PAGE analysis. Lane 1: protein molecular weight marker (kDa); Lane 2: normal sf9 cells; Lane 3: infected sf9 cells. The arrows (A) indicate the new foreign proteins. (B) Western blot identification for Ang II using an enhanced chemiluminescence (ECL) assay. The numbers to the left indicate positions of protein molecular weight marker (kDa). Lane 1: normal sf9 cells; Lane2: infected sf9 cells. Western blot exposed a specific protein bands at a molecular mass of~37 kDa, and the protein band may represent the VP1–2A-4Ang IIs subunit of pHAV-4Ang IIs.

Figure 4. IFA results of infected sf9 cell to detection of pHAV-4Ang IIs. (A) pHAV-4Ang IIs in normal sf9 cells. No specific fluorescence was observed; (B) pHAV-4Ang IIs in infected sf9 cells. Specific green fluorescence was observed.
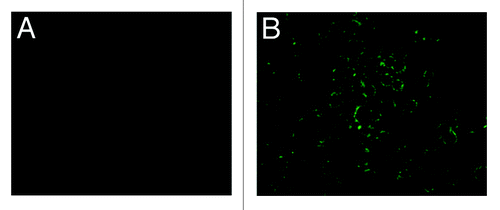
Figure 4. IFA results of infected sf9 cell to detection of pHAV-4Ang IIs. (A) pHAV-4Ang IIs in normal sf9 cells. No specific fluorescence was observed; (B) pHAV-4Ang IIs in infected sf9 cells. Specific green fluorescence was observed.

Figure 5. The particles of pHAV-4Ang IIs observed using an electron microscope. The red (a) arrows indicate the particles of pHAV-4Ang IIs. The red (b) arrows indicate the recombinant baculovirus. (A) The particles in whole infected sf9 cells observed (×2,000 zoom in). (B) Large amounts of pHAV-4Ang IIs particles observed in the cytoplasm, which amplified from the rectangle delineation in (A)(×5,000 zoom in).
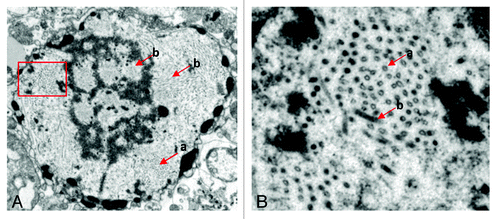
Figure 5. The particles of pHAV-4Ang IIs observed using an electron microscope. The red (a) arrows indicate the particles of pHAV-4Ang IIs. The red (b) arrows indicate the recombinant baculovirus. (A) The particles in whole infected sf9 cells observed (×2,000 zoom in). (B) Large amounts of pHAV-4Ang IIs particles observed in the cytoplasm, which amplified from the rectangle delineation in (A)(×5,000 zoom in).

Figure 6. Efficacy of immunization with pHAV-4Ang IIs. Groups of SHR were immunized on days 0 and 21 with PBS (◆, n = 10), pHAV-4AngIIs (■, n = 10) as described. Blood pressure (BP) was measured by tail-cuff arterial blood pressure measurement method; the AngII-specific antibody titers and the Ang II levels in sera were determined by enzyme-linked immunosorbent assay (ELISA). Data of BP and the Ang II levels are presented as the average of each group; Data of antibody titers are presented as the geometric mean titer (GMT) of each group. Error bars indicate the standard error of the mean. (A) Effect of vaccination on SBP. Significant differences (p < 0.05) between the pHAV-4AngIIs(■) and the PBS(◆) group were found at weeks 4–12 by statistics analysis . (B) Effect of vaccination on DBP. Significant differences (p < 0.05) between the pHAV-4AngIIs(■) and the PBS(◆) group were found at weeks 6–12 by statistics analysis.(C) Effect of vaccination on antibody titers. The AngII-specific IgG antibody titers were tested in the sera. The Significant differences (p < 0.05) between the pHAV-4AngIIs(■) and the PBS(◆) group were indicated at weeks 2–12 by statistics analysis. (D) Effect of vaccination on the Ang II levels in sera. The Significant differences (p < 0.05) between the pHAV-4AngIIs (■) and the PBS(◆) group were indicated at weeks 4–12 by statistics analysis.(E) The correlation between SBP(●) and the AngII-specific IgG antibody titer(▲) in the pHAV-4AngIIs group. There is an inverse correlation between antibody titer and SBP(r = -0.734, p = 0.006). (F) The correlation between DBP( × ) and the AngII-specific IgG antibody titer(▲) in the pHAV-4AngIIs group. There is also an inverse correlation between antibody titer and DBP(r = -0.477, p = 0.027).
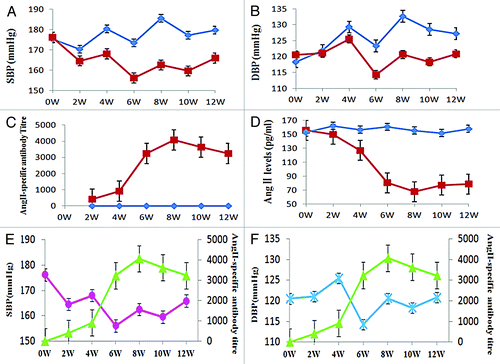
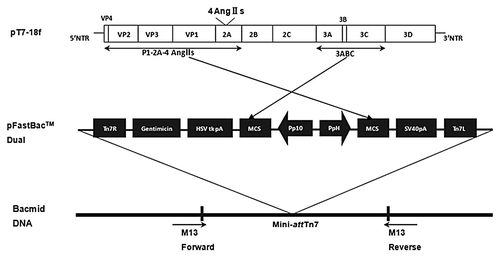
Figure 6. Efficacy of immunization with pHAV-4Ang IIs. Groups of SHR were immunized on days 0 and 21 with PBS (◆, n = 10), pHAV-4AngIIs (■, n = 10) as described. Blood pressure (BP) was measured by tail-cuff arterial blood pressure measurement method; the AngII-specific antibody titers and the Ang II levels in sera were determined by enzyme-linked immunosorbent assay (ELISA). Data of BP and the Ang II levels are presented as the average of each group; Data of antibody titers are presented as the geometric mean titer (GMT) of each group. Error bars indicate the standard error of the mean. (A) Effect of vaccination on SBP. Significant differences (p < 0.05) between the pHAV-4AngIIs(■) and the PBS(◆) group were found at weeks 4–12 by statistics analysis . (B) Effect of vaccination on DBP. Significant differences (p < 0.05) between the pHAV-4AngIIs(■) and the PBS(◆) group were found at weeks 6–12 by statistics analysis.(C) Effect of vaccination on antibody titers. The AngII-specific IgG antibody titers were tested in the sera. The Significant differences (p < 0.05) between the pHAV-4AngIIs(■) and the PBS(◆) group were indicated at weeks 2–12 by statistics analysis. (D) Effect of vaccination on the Ang II levels in sera. The Significant differences (p < 0.05) between the pHAV-4AngIIs (■) and the PBS(◆) group were indicated at weeks 4–12 by statistics analysis.(E) The correlation between SBP(●) and the AngII-specific IgG antibody titer(▲) in the pHAV-4AngIIs group. There is an inverse correlation between antibody titer and SBP(r = -0.734, p = 0.006). (F) The correlation between DBP( × ) and the AngII-specific IgG antibody titer(▲) in the pHAV-4AngIIs group. There is also an inverse correlation between antibody titer and DBP(r = -0.477, p = 0.027).

Figure 7. Construction of recombinant bacmid-P1–2A-4AngIIs-3ABC.

Figure 7. Construction of recombinant bacmid-P1–2A-4AngIIs-3ABC.

Reprints and Corporate Permissions

Please note: Selecting permissions does not provide access to the full text of the article, please see our help page How do I view content?

To request a reprint or corporate permissions for this article, please click on the relevant link below:

Academic Permissions

Please note: Selecting permissions does not provide access to the full text of the article, please see our help page How do I view content?

Obtain permissions instantly via Rightslink by clicking on the button below:

If you are unable to obtain permissions via Rightslink, please complete and submit this Permissions form. For more information, please visit our Permissions help page.