Figures & data
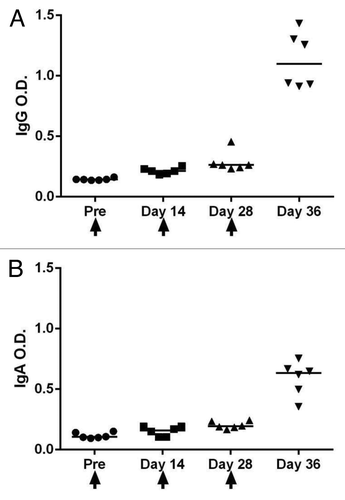
Figure 1. HIV-1 specific serum IgG (A) and HIV-1 specific fecal IgA (B) antibody titers following oral immunization. Mice (n = 6) were immunized orally on days 0, 14 and 28 with chitosan nanospheres loaded with HIV-1 Gp120 proteins MN, CM, LAN and Dukoral. Sera and fecal samples were collected after each vaccination and HIV-1 specific serum IgG (A) and HIV-1 specific fecal IgA (B) antibodies were measured by ELISA. Results are shown as the mean O.D 450 nm ± SEM. The arrows indicate the day of vaccine administration.