2,289
Views
59
CrossRef citations to date
0
Altmetric
Research Paper

Intranasal vaccination with an inactivated whole influenza virus vaccine induces strong antibody responses in serum and nasal mucus of healthy adults

, , , , , , , & show all
Pages 1962-1970 | Received 20 Mar 2013, Accepted 19 Jun 2013, Published online: 27 Jun 2013

Figures & data

Figure 1. HI antibody responses in serum. (A) HI antibody responses before and after primary and secondary vaccination are shown for serum. A paired t test was performed to compare data from week 0 (pre) and 6 (post). Correlation coefficient (r) and p value were calculated. *; p < 0.05. (B) The relationship of serum HI antibody responses before and after secondary vaccination. The abscissa and ordinate show the pre- and post-vaccination HI titers, respectively. Further, it is shown how these relate to conversion rate and protection rate, which are on the border or within the area marked by the bold line and by the light gray background, respectively. Each circle represents an individual and shows the relation between the pre- and post-vaccination titers. Gray circles indicate subjects between 60 and 69 y-of-age.
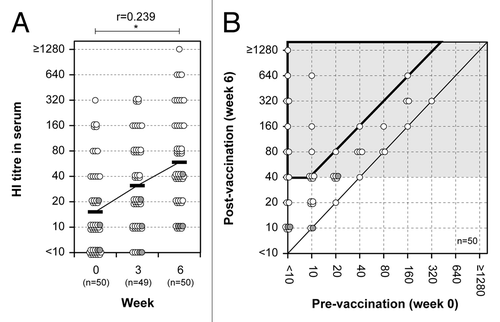
Figure 1. HI antibody responses in serum. (A) HI antibody responses before and after primary and secondary vaccination are shown for serum. A paired t test was performed to compare data from week 0 (pre) and 6 (post). Correlation coefficient (r) and p value were calculated. *; p < 0.05. (B) The relationship of serum HI antibody responses before and after secondary vaccination. The abscissa and ordinate show the pre- and post-vaccination HI titers, respectively. Further, it is shown how these relate to conversion rate and protection rate, which are on the border or within the area marked by the bold line and by the light gray background, respectively. Each circle represents an individual and shows the relation between the pre- and post-vaccination titers. Gray circles indicate subjects between 60 and 69 y-of-age.

Table 1. Tools currently in use to evaluate vaccine-induced changes in serum HI titer

Table 2. Serum HI antibody responses after two doses of the nasal A/Victoria vaccine

Figure 2. Neutralizing antibody responses and correlation between HI and NT titers in serum. (A) Neutralizing antibody responses before and after primary and secondary vaccination are shown. A paired t test was performed to compare data from week 0 (pre) and 6 (post). The correlation coefficient (r) and p value were calculated. **; p < 0.01. (B) Correlation between HI and NT titers in serum 3 weeks after the secondary nasal vaccination. The abscissa and ordinate show HI and NT titers, respectively. Pearson r value and p value were calculated. Each individual is represented by a circle showing corresponding HI and NT titers. Gray circles indicate subjects between 60 and 69 y-of-age.
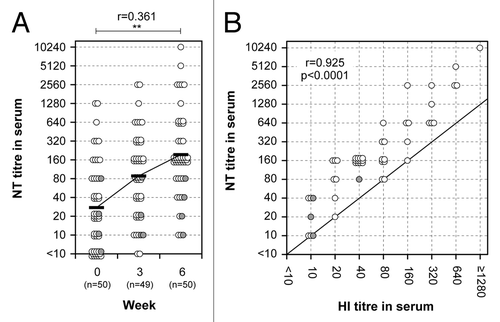
Figure 2. Neutralizing antibody responses and correlation between HI and NT titers in serum. (A) Neutralizing antibody responses before and after primary and secondary vaccination are shown. A paired t test was performed to compare data from week 0 (pre) and 6 (post). The correlation coefficient (r) and p value were calculated. **; p < 0.01. (B) Correlation between HI and NT titers in serum 3 weeks after the secondary nasal vaccination. The abscissa and ordinate show HI and NT titers, respectively. Pearson r value and p value were calculated. Each individual is represented by a circle showing corresponding HI and NT titers. Gray circles indicate subjects between 60 and 69 y-of-age.
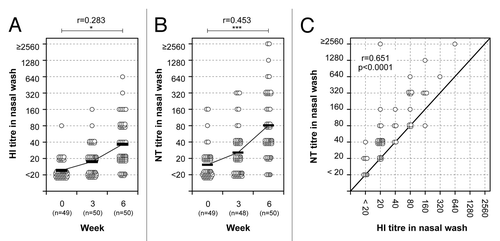
Table 3. Serum neutralizing antibody responses after two doses of the nasal vaccine

Figure 3. HI and neutralizing antibody responses in nasal mucus. HI (A) and NT (B) titers before and after primary and secondary vaccination. A paired t test was performed to compare data from week 0 (pre) and 6 (post). The correlation coefficient (r) and p value were calculated. *; p < 0.05, ***; p < 0.001. (C) Correlation between HI and NT titers in nasal wash 3 weeks after the secondary nasal vaccination. The abscissa and ordinate show HI and NT titers, respectively. Pearson r value and p value were calculated. Each circle represents an individual showing corresponding HI and NT titers. Gray circles indicate subjects between 60 and 69 y-of-age.

Figure 3. HI and neutralizing antibody responses in nasal mucus. HI (A) and NT (B) titers before and after primary and secondary vaccination. A paired t test was performed to compare data from week 0 (pre) and 6 (post). The correlation coefficient (r) and p value were calculated. *; p < 0.05, ***; p < 0.001. (C) Correlation between HI and NT titers in nasal wash 3 weeks after the secondary nasal vaccination. The abscissa and ordinate show HI and NT titers, respectively. Pearson r value and p value were calculated. Each circle represents an individual showing corresponding HI and NT titers. Gray circles indicate subjects between 60 and 69 y-of-age.

Table 4. Nasal HI and neutralizing antibody responses after two doses of the nasal vaccine

Table 5. Serum and nasal HA-specific antibody responses after two doses of the nasal vaccine

Table 6. Cross-reactive HI and neutralizing antibody responses to A/Sydney virus after two doses of the A/Victoria vaccine

Supplemental material

Additional material

Download Zip (540.8 KB)