1,614
Views
14
CrossRef citations to date
0
Altmetric
Research Paper

Clinical validation of IFNγ/IL-10 and IFNγ/IL-2 FluoroSpot assays for the detection of Tr1 T cells and influenza vaccine monitoring in humans

, , , , , , , , , , , , & show all
Pages 104-113 | Received 27 May 2013, Accepted 24 Sep 2013, Published online: 01 Oct 2013

Figures & data

Figure 1. Detection of dual IFNγ− and IL-10-producing cells using the FluoroSpot assay and flow cytometry. Increasing numbers of transfected CHOγ10 cells constitutively secreting IFNγ and IL-10 cytokines were mixed with non-transfected CHO cells. Each cellular mix was incubated overnight in medium in FluoroSpot plates (105 cells/well). An amount of 5 µg/ml Brefeldin A was added 6 h after the start of incubation for intracellular cytokine staining (ICS) by flow cytometry. Each FluoroSpot condition was performed in triplicate. (A) Image of an IFNγ/IL-10 FluoroSpot with dual-color spots: green filter (IFNγ green spot), red filter (IL-10 red spots), and composite picture of both filters. (B) Same composite picture as in (A), counted with Immunospot® 5.16 (dual color spots are circled in white). Comparative analysis of signal obtained for IFNγ (C), IL-10 (D), and dual IFNγ+/IL10+ detection using the FluoroSpot assay or flow cytometry (ICS).
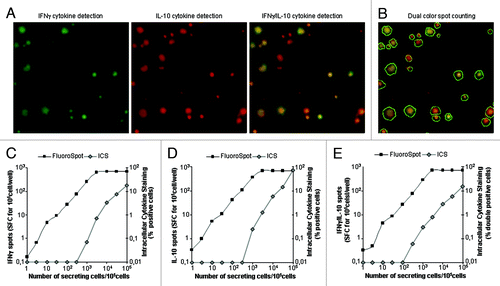
Figure 1. Detection of dual IFNγ− and IL-10-producing cells using the FluoroSpot assay and flow cytometry. Increasing numbers of transfected CHOγ10 cells constitutively secreting IFNγ and IL-10 cytokines were mixed with non-transfected CHO cells. Each cellular mix was incubated overnight in medium in FluoroSpot plates (105 cells/well). An amount of 5 µg/ml Brefeldin A was added 6 h after the start of incubation for intracellular cytokine staining (ICS) by flow cytometry. Each FluoroSpot condition was performed in triplicate. (A) Image of an IFNγ/IL-10 FluoroSpot with dual-color spots: green filter (IFNγ green spot), red filter (IL-10 red spots), and composite picture of both filters. (B) Same composite picture as in (A), counted with Immunospot® 5.16 (dual color spots are circled in white). Comparative analysis of signal obtained for IFNγ (C), IL-10 (D), and dual IFNγ+/IL10+ detection using the FluoroSpot assay or flow cytometry (ICS).

Figure 2. Detection of Tr1 cells by an IFNγ-IL-10 FluoroSpot assay. Tr1 cells were generated by coculturing CD4+CD25- cells with allogeneic DC (see Methods). One week after the second stimulation, cells were recovered and cultured with medium or activated for 24 h with allogeneic DC alone or in combination with PHAp. The IFNγ-IL-10 FluoroSpot assay was revealed 24 h later. (A) Quantitative and qualitative analysis of IFNγ-IL-10 FluoroSpot assay from Tr1-generated T cells. (B) Example of IFNγ-IL-10 FluoroSpot in activated Tr1 T cells. IFNγ and IL-10 FluoroSpots are green and red, respectively. Mixed dual IFNγ-IL-10 FluoroSpot are circled. (C) PBMC were stimulated with PHAp and LPS and the cytokines produced were revealed by an IFNγ-IL-10 FluoroSpot assay. Error bars represent the SD of triplicate wells in the FluoroSpot. These experiments were performed in duplicate.
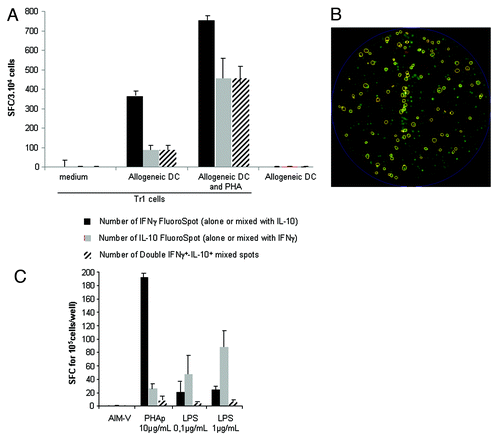
Figure 2. Detection of Tr1 cells by an IFNγ-IL-10 FluoroSpot assay. Tr1 cells were generated by coculturing CD4+CD25- cells with allogeneic DC (see Methods). One week after the second stimulation, cells were recovered and cultured with medium or activated for 24 h with allogeneic DC alone or in combination with PHAp. The IFNγ-IL-10 FluoroSpot assay was revealed 24 h later. (A) Quantitative and qualitative analysis of IFNγ-IL-10 FluoroSpot assay from Tr1-generated T cells. (B) Example of IFNγ-IL-10 FluoroSpot in activated Tr1 T cells. IFNγ and IL-10 FluoroSpots are green and red, respectively. Mixed dual IFNγ-IL-10 FluoroSpot are circled. (C) PBMC were stimulated with PHAp and LPS and the cytokines produced were revealed by an IFNγ-IL-10 FluoroSpot assay. Error bars represent the SD of triplicate wells in the FluoroSpot. These experiments were performed in duplicate.

Figure 3. Comparison of FluoroSpot and ELISpot to detect T-cell response using various commercial kits. IFNγ and IL-2 responses of PBMC (2.105) from healthy donors or patients after various stimulatory conditions were detected with ELISpot kits from Diaclone® and Mabtech® and FluoroSpot kits from Mabtech®. Spot counts were compared. (A) Comparative analysis of spots counts using these three techniques in representative healthy donors. Three healthy donors were selected for these experiments. (B) Correlation between IFNγ and IL-2 spots detected with Diaclone® ELISpot and Mabtech® FluoroSpot after stimulation of PBMC from patients vaccinated with Mutagrip® influenza seasonal vaccine (baseline levels and vaccine-induced T cells were pooled for this analysis). An amount of 160 samples were included for this comparison and some samples were tested at various dilutions. Error bars represent the SD of triplicate wells in the ELISpot or FluoroSpot
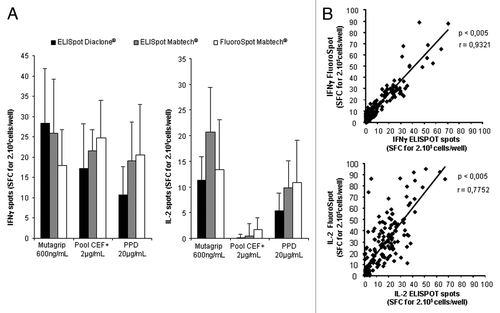
Figure 3. Comparison of FluoroSpot and ELISpot to detect T-cell response using various commercial kits. IFNγ and IL-2 responses of PBMC (2.105) from healthy donors or patients after various stimulatory conditions were detected with ELISpot kits from Diaclone® and Mabtech® and FluoroSpot kits from Mabtech®. Spot counts were compared. (A) Comparative analysis of spots counts using these three techniques in representative healthy donors. Three healthy donors were selected for these experiments. (B) Correlation between IFNγ and IL-2 spots detected with Diaclone® ELISpot and Mabtech® FluoroSpot after stimulation of PBMC from patients vaccinated with Mutagrip® influenza seasonal vaccine (baseline levels and vaccine-induced T cells were pooled for this analysis). An amount of 160 samples were included for this comparison and some samples were tested at various dilutions. Error bars represent the SD of triplicate wells in the ELISpot or FluoroSpot

Figure 4. Qualitative influenza vaccine-specific T-cell response using dual IFNγ/IL-2 FluoroSpot assay. Forty PBMC (2.105) from patients were pulsed with Mutagrip composed of a mixture of influenza antigens before (D0) or 21 d after seasonal influenza vaccination with Mutagrip and the reaction was revealed with double IFNγ/L-2 FluoroSpot assay (A) Representative image of a T-cell response to Mutagrip (green, IFNγ FluoroSpot; red, IL-2 FluoroSpot; yellow, IFNγ/IL-2 mixed FluoroSpot). (B) Qualitative analysis at D0 and D21 of anti-Mutagrip T cell response using dual IFNγ/IL-2 FluoroSpot assay. IFNγ and IL-2 T cell responses correspond to monoparametric response to IFNγ and IL-2, whereas IFNγ+IL-2+ T-cell response corresponds to T cells producing both cytokines with mixed spots. (C) Left: Analysis of the number and percentage of patients responding to Mutagrip at day 21 using the dual IFNγ/IL-2 FluoroSpot assay. Right: Qualitative analysis of T-cell response in patients with vaccine-induced T-cell response. (D) Box and whisker plots of the IFNγ, IL-2 and IFNγ-IL-2 response before and 21 d after the vaccine is shown for the whole population. FluoroSpot assay was performed in triplicate.
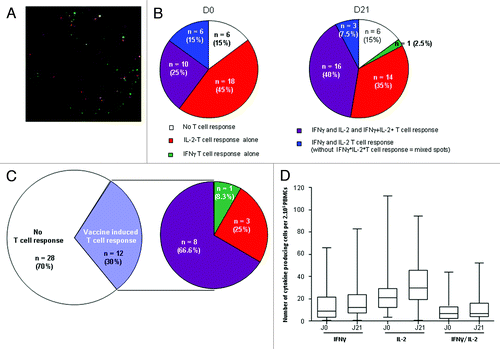
Figure 4. Qualitative influenza vaccine-specific T-cell response using dual IFNγ/IL-2 FluoroSpot assay. Forty PBMC (2.105) from patients were pulsed with Mutagrip composed of a mixture of influenza antigens before (D0) or 21 d after seasonal influenza vaccination with Mutagrip and the reaction was revealed with double IFNγ/L-2 FluoroSpot assay (A) Representative image of a T-cell response to Mutagrip (green, IFNγ FluoroSpot; red, IL-2 FluoroSpot; yellow, IFNγ/IL-2 mixed FluoroSpot). (B) Qualitative analysis at D0 and D21 of anti-Mutagrip T cell response using dual IFNγ/IL-2 FluoroSpot assay. IFNγ and IL-2 T cell responses correspond to monoparametric response to IFNγ and IL-2, whereas IFNγ+IL-2+ T-cell response corresponds to T cells producing both cytokines with mixed spots. (C) Left: Analysis of the number and percentage of patients responding to Mutagrip at day 21 using the dual IFNγ/IL-2 FluoroSpot assay. Right: Qualitative analysis of T-cell response in patients with vaccine-induced T-cell response. (D) Box and whisker plots of the IFNγ, IL-2 and IFNγ-IL-2 response before and 21 d after the vaccine is shown for the whole population. FluoroSpot assay was performed in triplicate.

Table 1. Relationships between immunosuppressive therapy (with immunosuppressors [IS] and/or anti-TNFα antibodies) and vaccine-induced IFNγ+IL-2+T cell responses −

Supplemental material

Additional material

Download Zip (810 KB)

Reprints and Corporate Permissions

Please note: Selecting permissions does not provide access to the full text of the article, please see our help page How do I view content?

To request a reprint or corporate permissions for this article, please click on the relevant link below:

Academic Permissions

Please note: Selecting permissions does not provide access to the full text of the article, please see our help page How do I view content?

Obtain permissions instantly via Rightslink by clicking on the button below:

If you are unable to obtain permissions via Rightslink, please complete and submit this Permissions form. For more information, please visit our Permissions help page.