Figures & data
Figure 1. SDS-PAGE and western blot analyses of the virion. (A) SDS-PAGE of CA16 virion. Land 1 is the purified CA16 virion; (B) Western blot picture of CA16 Virion. Lane 2 is the purified virion which was incubated with the anti-VP1 polyclonal-antibody.
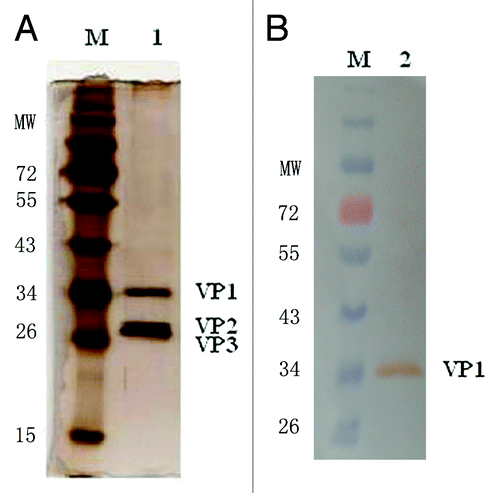
Figure 2. Electron microscopy of CA16 virions. Bar = 50 nm.
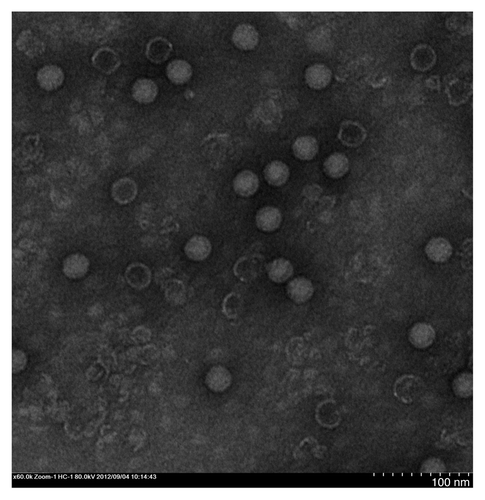
Figure 3. Timeline of mouse and rats immune procedures.
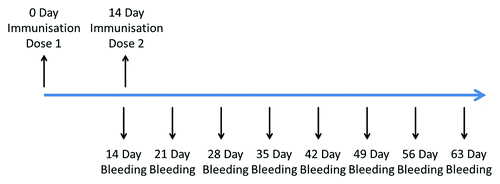
Figure 4. Serological responses of animals to immunization with the 419/CA16 vaccines. (A) the geometric mean ELISA titers of mouse; (B) the geometric mean neutralization titers of mouse; (C) the geometric mean ELISA titers of rats; (D) the geometric mean neutralization titers of rats; Error bars indicate the 95% confidence interval.
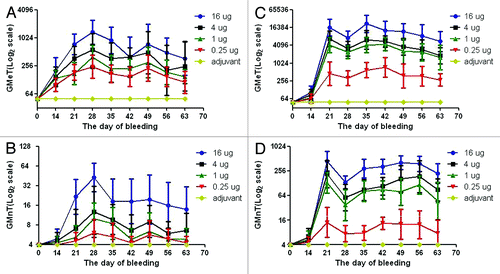
Figure 5. Timeline of cynomolgus monkeys immune procedures.
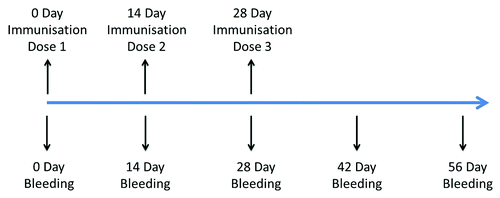
Figure 6. Antigen-specific neutralization and ELISA antibody levels in the serum of cynomolgus monkey. (A) Geometric mean of neutralization titers 56 d after prime and 28 d after boost vaccinations via the i.m route with CA16 vaccines containing 5 μg antigen. Each dot represents the individual titer of a monkey. (B) Geometric mean of ELISA titers 56 d after prime and 28 d after boost vaccinations via the i.m route with CA16 vaccines containing 5 μg antigen. In each Figure, horizontal bars indicate the geometric mean titers and error bars indicate the 95% confidence interval.
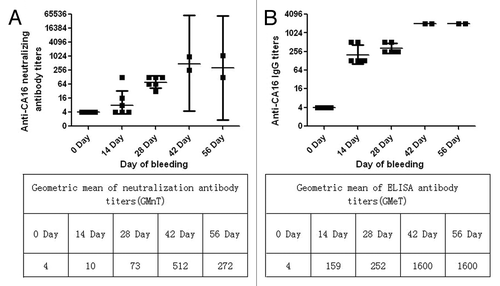
Table 1A. The table for LD50 calculation
Table 1B.
Figure 7. Intracerebral inoculation of 1131/CA16 results in dose-related mortality.
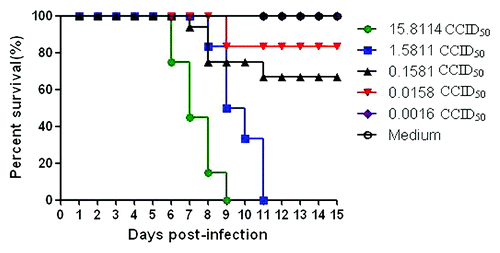
Figure 8. Virus loads in infant mouse tissues. Virus titers in tissues are expressed as mean Log10 PFU ± standard error of mean per 1 mg tissue from groups of 3 mice at 1, 3, 5 d post-infection. Virus titers in sera are expressed as the Log10 PFU per mililiter.
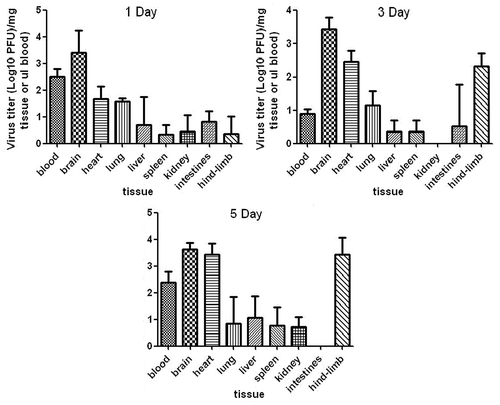
Table 2A. The passive immunizing protection assay (in vivo)
Table 2B.
Figure 9. Passive immunizing protection studies in mouse. Results are shown as Kaplan–Meier survival curves. The mice (n = 8) were i.m. injected with the CA16 vaccines and then challenged with 1 × 10² LD50 of CA16 strain 1131. Control mouse were immunized with adjuvant only.
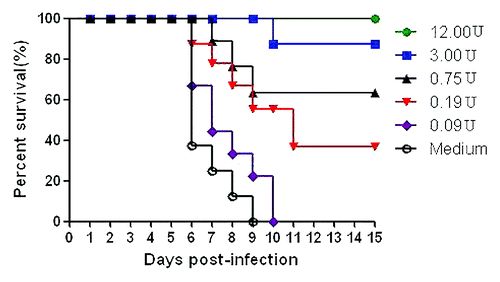
Figure 10. Timeline of mouse challenge procedures in the maternal antibody protection assay.
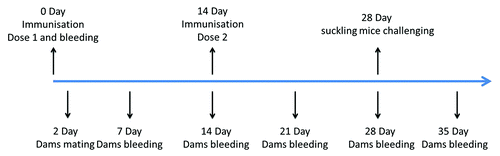
Figure 11. Serological responses of maternal mice to immunization with the 419/CA16 vaccines. (A) the geometric mean ELISA titers of maternal mice; Each point represents the geometric mean value (n = 10) ± 95% CI. (B) The geometric mean neutralization titers of maternal mice.
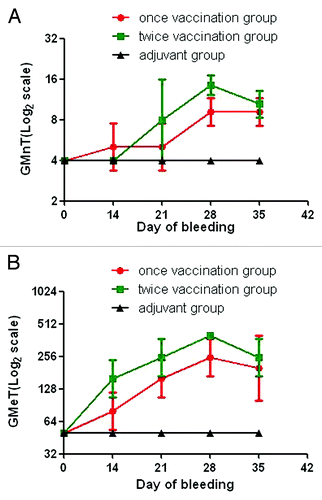
Figure 12. Maternal antibody protection studies in mice. Results are shown as Kaplan–Meier survival curves. The marternal mice (n = 8) were i.m. injected with the CA16 vaccine. After delivery (about 5 to 10 d after the boost), pups were i.c. challenged with 1 × 10² LD50 of 1131/CA16 (100 LD50/mouse) on postnatal day 3. Control mice were immunized with adjuvant only.
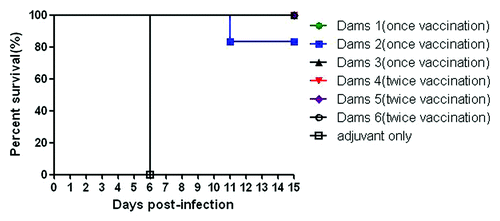
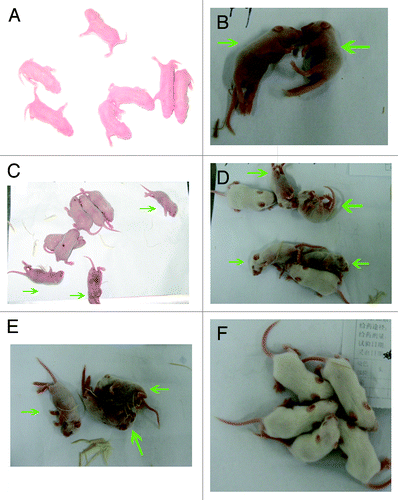
Figure 13. Viral infection of natal mouse by CA16 virus. (A) 0 d post challenge; (B), and (C) Mice at day 6 post infection are shown. The dead mice were indicated with green arrows; (D) and (E) 10 d post challenge. The dead mice were indicated with green arrows; (F) 14 d post challenge.