860
Views
11
CrossRef citations to date
0
Altmetric
Research Paper

Cell-mediated immune responses to respiratory syncytial virus infection

Magnitude, kinetics, and correlates with morbidity and age

&
Pages 1047-1056 | Received 15 Oct 2013, Accepted 19 Jan 2014, Published online: 10 Feb 2014

Figures & data

Table 1. Demographic and clinical characteristics

Figure 1. LPA responses to RSV during acute infection and convalescence. Data were derived from 29 subjects with acute RSV disease. Panel (A) shows SI calculated by dividing median cpm of RSV-stimulated by control wells; and panel (B) shows adjusted cpm calculated by subtracting median cpm of control from RSV-stimulated wells. N indicates the number of subjects who contributed data at each time point. Bars represent median and interquartile ranges. P values were calculated using Wilcoxon matched signed-rank test and are shown only for significant differences (P < 0.05).
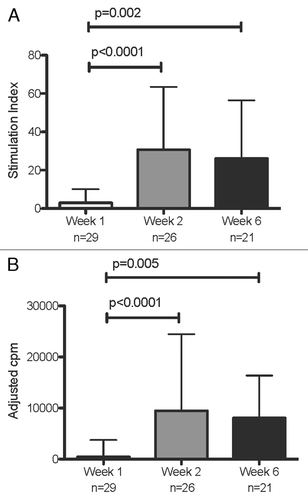
Figure 1. LPA responses to RSV during acute infection and convalescence. Data were derived from 29 subjects with acute RSV disease. Panel (A) shows SI calculated by dividing median cpm of RSV-stimulated by control wells; and panel (B) shows adjusted cpm calculated by subtracting median cpm of control from RSV-stimulated wells. N indicates the number of subjects who contributed data at each time point. Bars represent median and interquartile ranges. P values were calculated using Wilcoxon matched signed-rank test and are shown only for significant differences (P < 0.05).
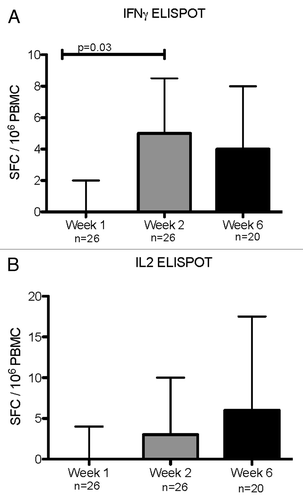
Figure 2. IFNγ (A) and IL-2 (B) ELISPOT responses during acute RSV infection and convalescence. Data were derived from 29 subjects with acute RSV disease. Results are reported as spot forming cells (SFC) per 10^6 PBMC. Bars represent median and interquartile ranges. N indicates the number of subjects who contributed data at each time point. P values were calculated using Wilcoxon matched signed-rank test and are shown only for significant differences (P < 0.05).

Figure 2. IFNγ (A) and IL-2 (B) ELISPOT responses during acute RSV infection and convalescence. Data were derived from 29 subjects with acute RSV disease. Results are reported as spot forming cells (SFC) per 10^6 PBMC. Bars represent median and interquartile ranges. N indicates the number of subjects who contributed data at each time point. P values were calculated using Wilcoxon matched signed-rank test and are shown only for significant differences (P < 0.05).

Table 2. RSV-specific T cell responses during the first 6 weeks of disease

Figure 3. Significant correlations of the severity of RSV infection with early T cell responses (first week of disease). Data were derived from 25 subjects with acute RSV disease. Severity of RSV disease was measured by the duration of hospitalization. RSV-specific CD8+IL-9+ (A) and CD4+IL-22+ (B) were enumerated by flow cytometry and expressed as percentages of the parent CD4+ population. Coefficients of correlations and P values were generated using the Spearman correlation analysis.
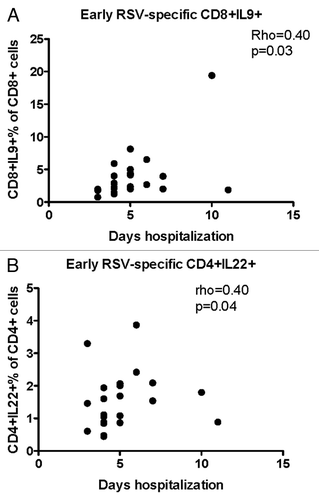
Figure 3. Significant correlations of the severity of RSV infection with early T cell responses (first week of disease). Data were derived from 25 subjects with acute RSV disease. Severity of RSV disease was measured by the duration of hospitalization. RSV-specific CD8+IL-9+ (A) and CD4+IL-22+ (B) were enumerated by flow cytometry and expressed as percentages of the parent CD4+ population. Coefficients of correlations and P values were generated using the Spearman correlation analysis.

Figure 4. Significant correlations of the severity of RSV infection with convalescent CMI responses (week 6). Data were derived from subjects with acute RSV disease. Severity of RSV disease was measured by the duration of hospitalization. Panel (A) shows stimulation indices measured by LPA (21 subjects). Panel (B) shows RSV-specific CD4+TNFα+% measured by flow cytometry (20 subjects). Coefficients of correlations and p values were generated using Spearman correlation analysis.
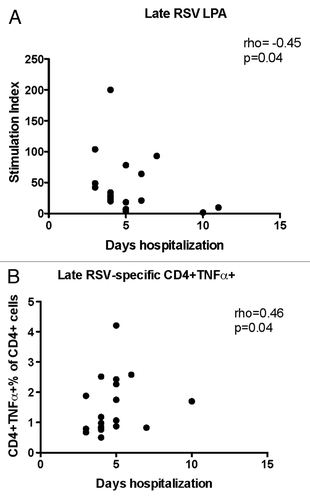
Figure 4. Significant correlations of the severity of RSV infection with convalescent CMI responses (week 6). Data were derived from subjects with acute RSV disease. Severity of RSV disease was measured by the duration of hospitalization. Panel (A) shows stimulation indices measured by LPA (21 subjects). Panel (B) shows RSV-specific CD4+TNFα+% measured by flow cytometry (20 subjects). Coefficients of correlations and p values were generated using Spearman correlation analysis.

Table 3. Correlations of RSV-specific T cell response with age at start of the disease

Figure 5. Gating strategy. The plots present the strategy used for identifying perforin-expressing cells as a typical example of the overall gating strategy. The left panel shows the selection of cells most likely to represent lymphocytes based on their size (x-axis) and granularity (y-axis); the middle panel shows the selection of CD4+ and CD8+ T cell populations based on the expression of the CD3 receptor (y-axis) and on the absence or presence, respectively, of the CD8 receptor (x-axis); the right panel shows the selection of the CD4+(CD8-)perforin+ cells out of the total CD4+(CD8-) cells based on the expression of perforin (x-axis) plotted against side scatter (y-axis) for improved visualization.

Figure 5. Gating strategy. The plots present the strategy used for identifying perforin-expressing cells as a typical example of the overall gating strategy. The left panel shows the selection of cells most likely to represent lymphocytes based on their size (x-axis) and granularity (y-axis); the middle panel shows the selection of CD4+ and CD8+ T cell populations based on the expression of the CD3 receptor (y-axis) and on the absence or presence, respectively, of the CD8 receptor (x-axis); the right panel shows the selection of the CD4+(CD8-)perforin+ cells out of the total CD4+(CD8-) cells based on the expression of perforin (x-axis) plotted against side scatter (y-axis) for improved visualization.

Reprints and Corporate Permissions

Please note: Selecting permissions does not provide access to the full text of the article, please see our help page How do I view content?

To request a reprint or corporate permissions for this article, please click on the relevant link below:

Academic Permissions

Please note: Selecting permissions does not provide access to the full text of the article, please see our help page How do I view content?

Obtain permissions instantly via Rightslink by clicking on the button below:

If you are unable to obtain permissions via Rightslink, please complete and submit this Permissions form. For more information, please visit our Permissions help page.