Figures & data
Figure 1. Zoledronic acid treatment does not modify the morphology of monocyte-derived DCs. Mature DCs were differentiated from untreated (A) and ZA-treated (B) CD14+ cells from melanoma patients. DC preparation was examined by light microscopy after May–Grunwald-Giemsa staining. A representative experiment using the cells from a patient in stage III of the disease is shown. DCs, dendritic cells; ZA, zoledronic acid.
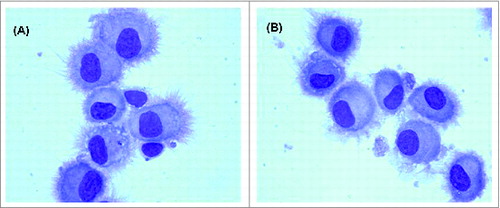
Figure 2. Effects of zoledronic acid treatment on the phenotype (A) and function (B) of monocyte-derived DCs. CD14 expression and phagocytic activity (evaluated by FITC-dextran uptake) were measured using immature DCs. HLA-DR, CD40, CD80, and CD83 expression and allostimulatory activity (assessed by DNA staining for S phase of the cell cycle) were measured using mature DCs. Bars represent the mean ± SEM of percent positive cells or the mean fluorescence intensity (MFI) of each observation. Black bars indicate the ZA-treated samples. Significant differences are indicated: *P < 0.05, **P < 0.01. HC, healthy controls; ΔMFI, difference in MFI between the cell fractions of the same sample incubated at 37°C and 0°C, respectively
Figure 3. Effects of zoledronic acid treatment on the phenotype (A) and function (B) of monocyte-derived DCs. The patient population was divided into two groups based on CD14 expression: one with levels comparable to normal controls (group A) and the other one with 1 SD more than the mean of the controls (group B). Bars represent the mean ± SEM of percent positive cells or the mean fluorescence intensity (MFI) of each observation. Black bars indicate the ZA-treated samples. Statistical significance is in comparison to untreated samples, unless otherwise indicated: *P < 0.05; **P < 0.01; §P < 0.05, §§P < 0.01, §§§P < 0.001, untreated samples vs. healthy controls; †P < 0.05, ††P < 0.01, ZA-treated samples vs. healthy controls. HC, healthy controls; Pts, overall patient population; ΔMFI, difference in MFI between the cell fractions of the same sample incubated at 37°C and 0°C, respectively.