Figures & data
Figure 1. The period of vulnerability for infant infectious disease (ref. Citation11).
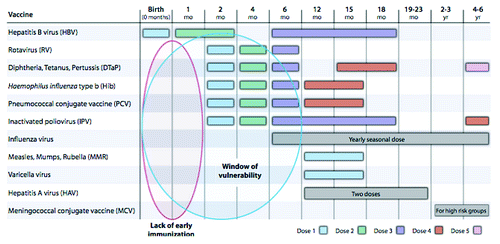
Figure 2. The recorded incidence of pertussis infection in the UK (ref. Citation1).
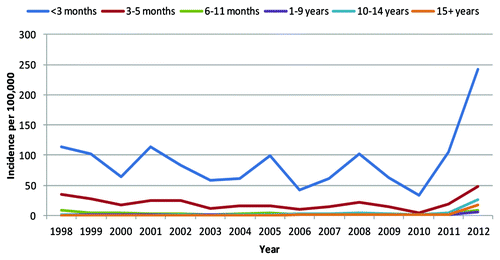
Figure 3. Laboratory confirmed pertussis cases and hospital admissions between January 2011 and June 2013, England only (ref. Citation1).
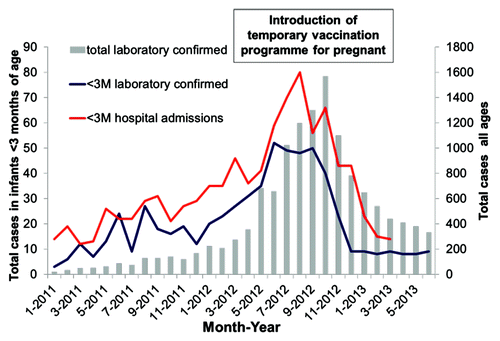
Figure 4. Cumulative cases of laboratory-proven influenza in infants whose mothers received influenza vaccine, as compared with control subjects (ref. Citation16).
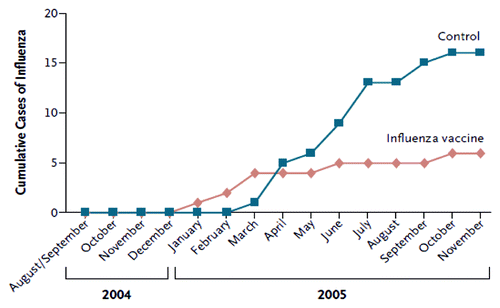
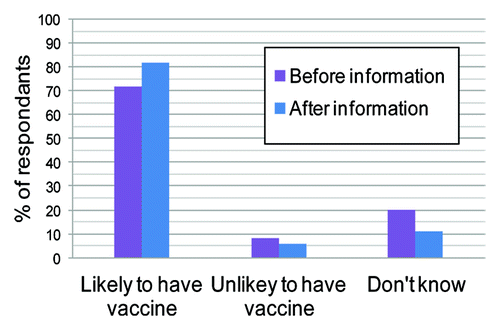
Figure 5. Response to the question “How likely would you be to have a GBS vaccine in pregnancy?” (ref. Citation5).